
Using Ecommerce Analytics Day to Day: A Founder’s Playbook
By Arthur Falcone · Founder of Arlo
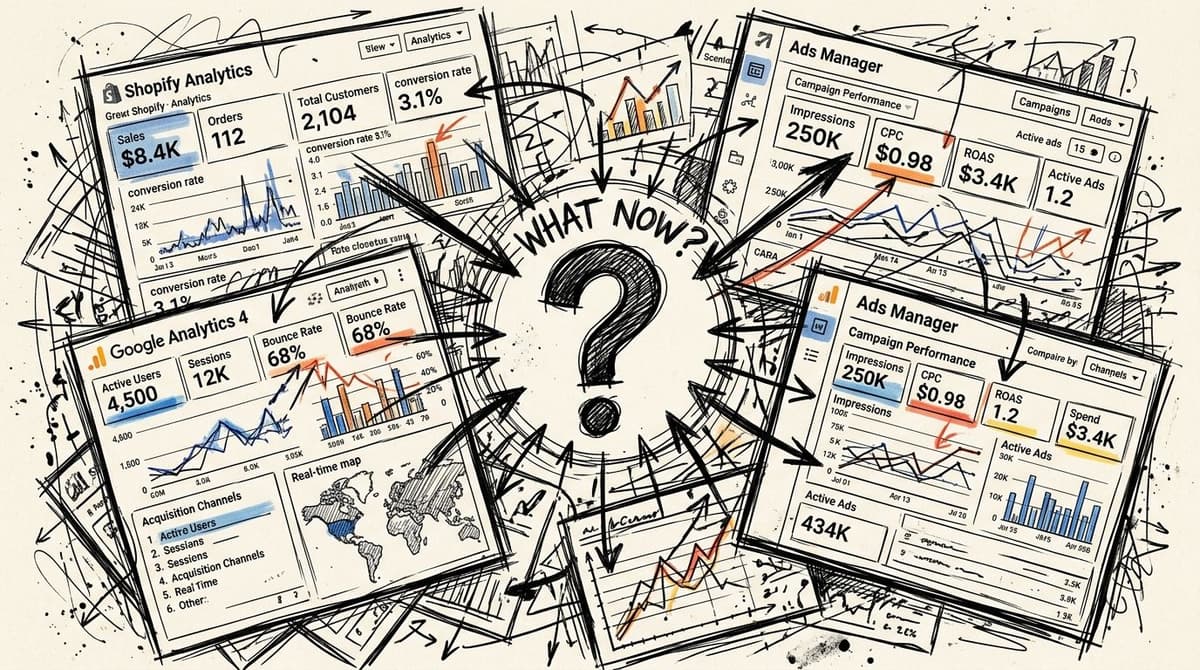
You’re probably looking at three tabs right now. Shopify says one thing. GA4 says another. Meta and Google Ads both want credit for the same sale. You can see the numbers, but you still don’t know what deserves your attention this week.
That’s the core problem with analytics in ecommerce. Most founders don’t need more dashboards. They need a way to turn raw signals into a short, ranked action list tied to revenue and profit. If your reporting doesn’t tell you what changed, why it matters, and what to fix first, it’s not helping. It’s just adding noise.
This post is the day-to-day layer of our complete Shopify marketing analytics guide: how to actually read your numbers each week. If you’re still deciding what to read them in, start with how to choose an ecommerce analytics platform instead.
#Table of Contents
- From Data Overload to Decisive Action
- The Six Core Ecommerce Signals You Must Track
- How to Interpret Changes and Prioritize What Matters
- Common Reporting Pitfalls That Cost Founders Money
- An Actionable Workflow From Insight to Revenue
- Your Shopify Analytics Starter Checklist
#From Data Overload to Decisive Action
It’s Monday morning. Revenue came in light over the weekend. Shopify says sales dipped. GA4 shows a traffic shift. Meta says performance is fine. Klaviyo reports solid click rates. You have four dashboards open and still no answer to the only question that matters: what should you do first?
That is the failure point in ecommerce analytics. Raw reporting shows movement. Useful analytics ranks the problem. Strong analytics turns that ranking into a short action list based on expected dollar impact.
More demand in ecommerce does not make this easier. It raises the cost of bad prioritization. If you chase the wrong metric for a week, you do not just lose time. You leave revenue on the table, miss margin leaks, and teach your team to react to noise.
#Why dashboards create confusion
Many founders running seven and eight figure stores have plenty of reports already. The problem is that their tools were built to measure activity, not to rank decisions by financial consequence.
So the data shows up fragmented.
- Shopify shows revenue: but not the main driver behind the change.
- GA4 shows behavior: but not which break in the journey is worth the most money.
- Ad platforms show platform results: but not whether those customers hold margin or come back.
- Email tools show campaign performance: but not whether retention is offsetting expensive acquisition.
A report that ends with “interesting” is dead weight.
You need every review to answer three questions, fast:
- What changed
- Why it changed
- What should we do now, in order of likely dollar impact
#What decisive analytics looks like
Founders do not need more definitions. They need a way to turn messy inputs into decisions.
Start with business outcomes. If revenue is down, split the problem into the few drivers that can explain it. Traffic quality, conversion rate, average order value, repeat purchase behavior, contribution margin, and channel mix usually get you close to the answer fast. Then estimate the size of each issue in dollars. A 10 percent drop in conversion on your highest traffic landing page deserves attention before a small email click decline. A margin hit from rising discount rate can matter more than a top line lift from paid social.
This is the shift that matters. Stop reviewing metrics as isolated readings. Review them as competing explanations for lost or gained profit.
Good operators do this almost automatically. They ask which change is material, which cause is most likely, and which fix pays back fastest. That is how analytics becomes a decision system instead of a pile of charts.
#The Six Core Ecommerce Signals You Must Track
Monday morning. Revenue is off pace, Slack is full of screenshots, and your team is arguing about Meta, email, and site speed. None of that helps until you know which signal moved, how much money it put at risk, and whether the problem sits in acquisition, conversion, or retention.
Many Shopify stores track far too many metrics for the decisions they need to make. Founders do not need another dashboard stuffed with charts. They need six signals that explain where revenue and profit are being won or lost.
#Why most dashboards fail founders
A typical dashboard shows everything and prioritizes nothing. You get campaign names, pageviews, event counts, and channel tabs, but no clear answer about business health or what deserves action first.
That is the core problem.
If your reporting does not help you connect a metric change to likely dollar impact, it wastes time. The point of analytics in ecommerce is not to describe the store. It is to tell you where to focus next.
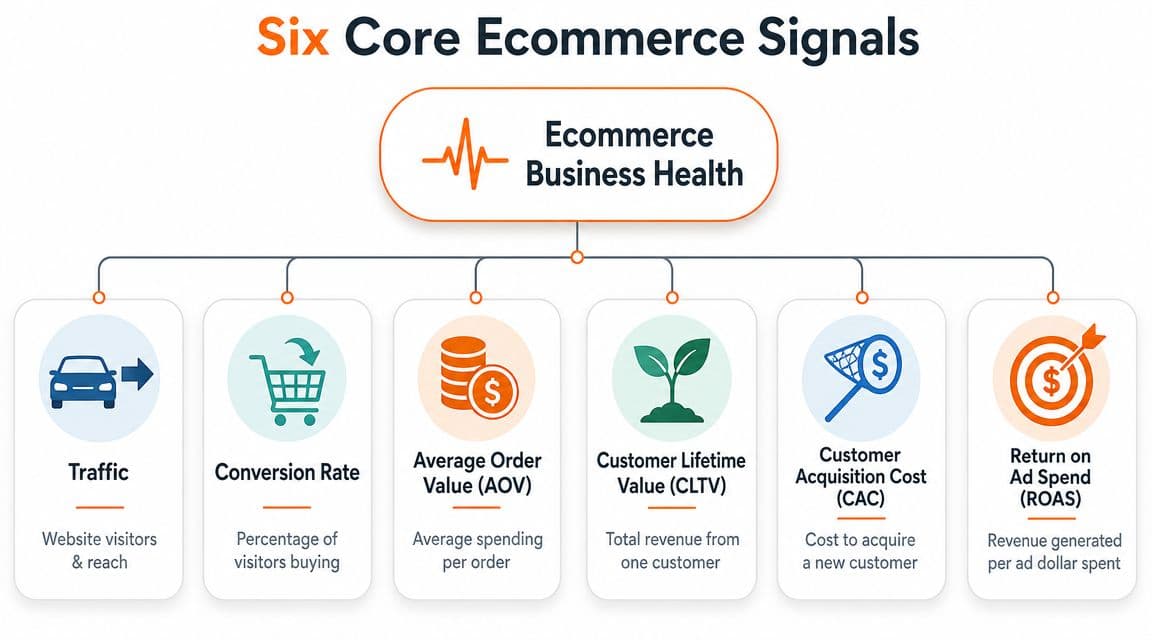
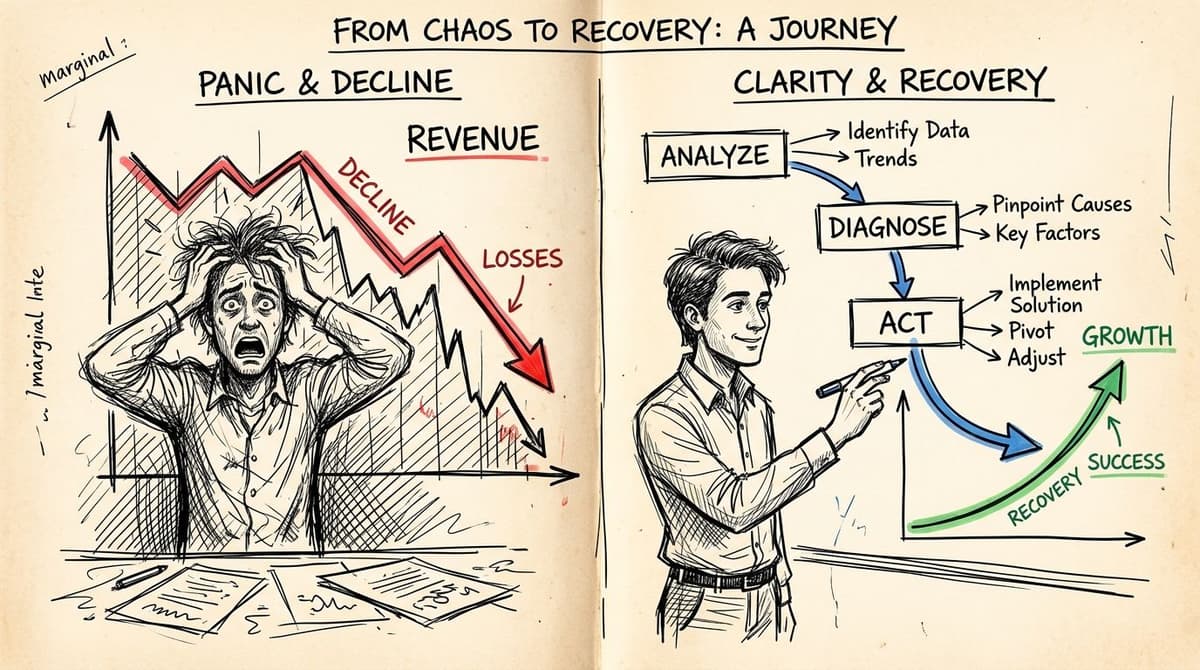
A quick visual primer helps if your team needs alignment:
#The six signals that run the business
#Traffic
Traffic answers one question. Are enough qualified people reaching the store?
This is your top-of-funnel input. If sessions fall, revenue often follows. If sessions rise and sales do not, stop celebrating and check traffic quality, landing page intent match, and device mix.
Review traffic by source, campaign, landing page, new vs returning visitors, and device. A traffic increase from low-intent clicks can make your dashboard look better while making your P and L worse.
#Conversion rate
Conversion rate answers: Are visitors turning into buyers at a healthy rate?
Offer strength, product page clarity, pricing, trust, page speed, and checkout friction are quickly reflected in conversion metrics. A weak conversion rate means you are paying to attract people your site fails to close.
Benchmark ranges can give context, as noted earlier, but your own baseline matters more. Track conversion by landing page, device, traffic source, and product category. That is how you find the leak that is costing real money.
#Average order value
AOV answers: How much revenue do we get each time someone buys?
AOV matters because it changes how much you can afford to spend on acquisition and still protect margin. Founders often chase lower CAC while ignoring the easier win sitting in bundles, quantity breaks, cart upsells, and better merchandising.
When AOV drops, do not stop at the number. Check discount rate, product mix, units per transaction, and attach rate on add-ons. Those are the levers.
#Customer retention rate
Retention answers: Do customers come back, or are we renting revenue one order at a time?
This signal tells you whether the product, post-purchase experience, replenishment timing, and lifecycle marketing are doing their jobs. If retention is weak, paid acquisition has to work harder every month just to keep you in place.
Look at repeat purchase rate by first product purchased, acquisition channel, and time to second order. That tells you which customers are worth more attention and which acquisition wins are fake wins.
#Lifetime value
LTV answers: What is a customer worth beyond the first order?
This is the number that should shape acquisition strategy. A channel that brings in lower-cost customers can still be a bad bet if those customers buy once, use heavy discounts, and never return.
Strong teams estimate LTV early, then compare it to CAC by channel, campaign, and first-order profile. The pattern we see across healthy Shopify stores: budget shifts toward channels whose predicted LTV clears 3x CAC, and away from channels that only look good on first-order ROAS. The LTV to CAC section of our KPI guide walks the math.
The cheapest customer to acquire is often the least valuable customer to keep buying.
#Cohort behavior
Cohort behavior answers: Are new customer groups getting better or worse over time?
Blended averages hide problems. You can hold a stable overall repeat rate while your last three monthly cohorts are deteriorating because you changed your offer, pushed harder discounts, or shifted channel mix.
Cohort analysis shows trend quality. It helps you catch a bad acquisition strategy before the damage shows up in blended retention or LTV.
#How to read these signals together
These six signals work as a system, not a checklist.
| Signal | What it tells you | Main business question |
|---|---|---|
| Traffic | Reach and visit volume | Are enough qualified people arriving? |
| Conversion rate | Store effectiveness | Are visitors turning into buyers? |
| AOV | Basket size | Are we maximizing each order? |
| Retention | Repeat demand | Are customers coming back? |
| LTV | Long-term customer value | Which customers are worth more investment? |
| Cohort behavior | Quality over time | Are newer customers getting better or worse? |
Use them in order. Start with the business outcome that changed. Then use these signals to isolate the cause and rank fixes by likely profit impact.
That is the standard. If a metric cannot help you decide what to do next and how much it is worth, it does not belong on the founder dashboard.
#How to Interpret Changes and Prioritize What Matters
Teams often stop at observation. Revenue dipped. Conversion rose. AOV softened. That’s not analysis. That’s narration.
The hard part is deciding what deserves action first. If your analytics in ecommerce doesn’t help you rank issues by urgency and likely payoff, you’ll keep doing busy work while the core problem stays unresolved.
#Start with the business outcome, not the channel
Founders often begin in the wrong place. Revenue drops, and they jump straight into Meta, Google, email, or site design based on instinct. That’s backwards.
Start with the outcome that changed. Then trace it down into the component signals that create it.
For example:
- Revenue down usually means traffic dropped, conversion rate dropped, AOV dropped, or some mix of the three.
- Revenue flat but profit squeezed often points to discounting, rising acquisition cost, poor product mix, or retention weakness.
- Traffic up without revenue growth usually means you bought the wrong visitors or the site failed to convert them.
Good diagnosis starts with business math, not channel loyalty.
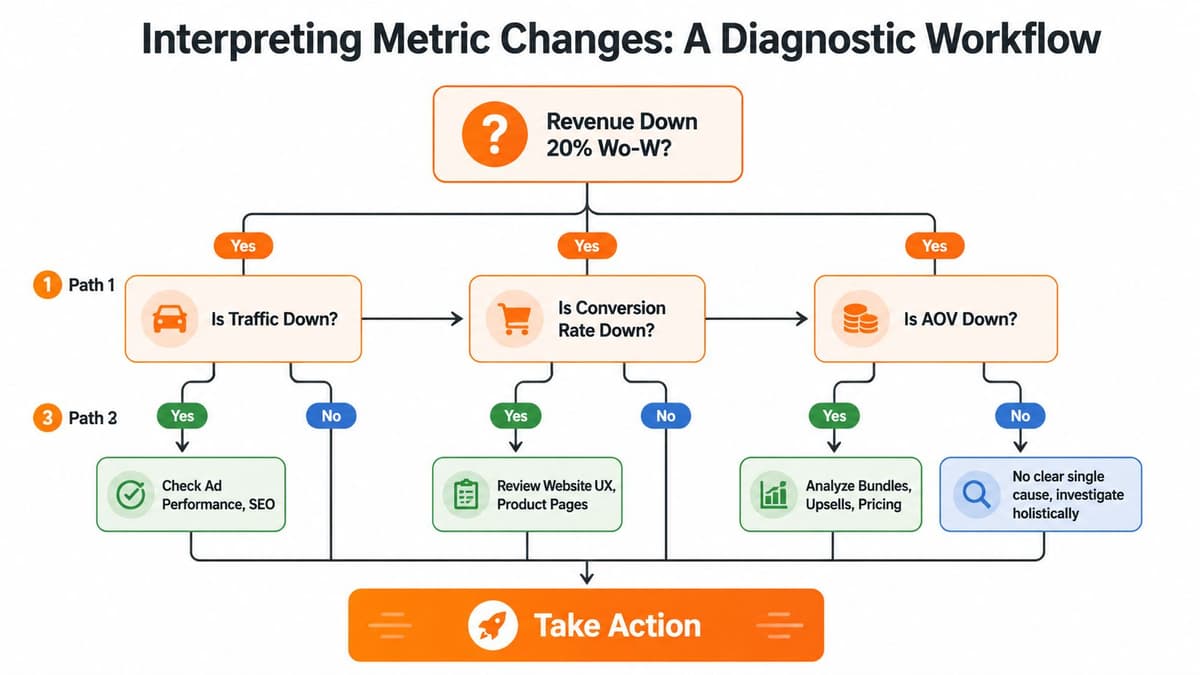
#Use a simple diagnostic tree
You don’t need an enterprise BI team to interpret changes well. You need a repeatable path.
When revenue is down, work through this order:
-
Check traffic first
Did sessions fall overall, or did one source drop hard? If yes, look at campaign spend, creative fatigue, tracking breaks, SEO visibility, email send volume, or landing-page issues. -
Then check conversion rate
If traffic is steady but orders are down, your site likely introduced friction. Review product pages, mobile UX, out-of-stock exposure, checkout flow, discount logic, and site errors. -
Then check AOV
If buyers are still converting but revenue fell, basket size may have shrunk. Look at product mix, bundle performance, upsells, and whether promotions changed customer behavior. -
Then check retention and cohort quality
If the top-line issue persists over time, the problem may be customer quality. New buyers may be less likely to return, making acquisition look fine in the short term while weakening the business underneath.
#Rank actions by dollar impact
Teams often make a critical mistake. They identify several possible issues and then treat them as equal. They aren’t.
A good action plan ranks fixes using three filters:
| Filter | What to ask |
|---|---|
| Revenue impact | If this is the cause, how much top-line is exposed? |
| Profit impact | Will fixing it improve contribution, not just sales volume? |
| Speed to act | Can the team implement a fix this week, or is it a long project? |
A broken checkout element beats a homepage redesign. A failing post-purchase flow can matter more than a new ad test. A mobile product page issue may deserve attention before almost anything else if that’s where most sessions and drop-offs happen.
Here’s the practical standard I recommend. Every week, make one list with only three items:
- Fix now: issues directly hurting conversion, checkout, or high-intent traffic
- Fix next: issues reducing AOV, repeat purchase, or channel efficiency
- Monitor: anything interesting but not urgent
That discipline matters more than another dashboard.
#Common Reporting Pitfalls That Cost Founders Money
Founders usually don’t lose money because they lack data. They lose money because they trust the wrong interpretation.
#Myth one daily swings need immediate action
Myth: Every dip needs a same-day reaction.
Reality: Daily numbers are noisy. If you overreact to every wobble, you train your team to thrash.
That doesn’t mean daily monitoring is useless. It means context matters. A one-day swing without supporting movement in the rest of the funnel usually doesn’t justify major changes. Founders who constantly pause ads, swap homepage sections, or push emergency discounts based on short windows often create more instability than they solve.
A better habit is to use daily data for alerts, then use a broader review window for decisions.
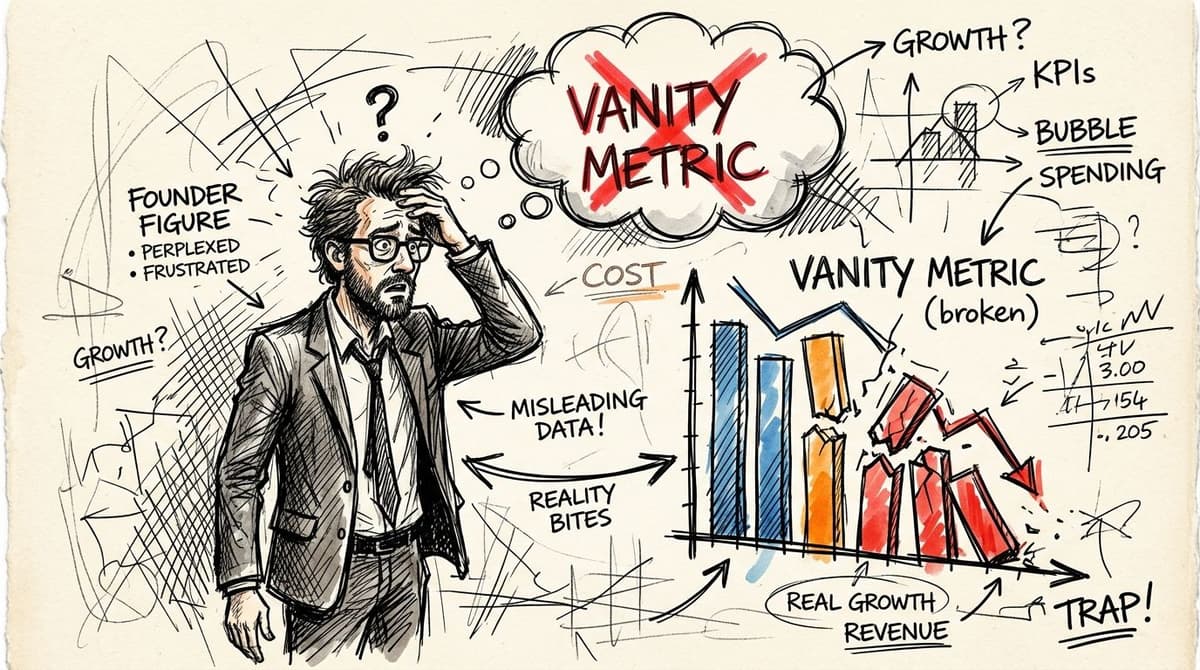
#Myth two blended ROAS tells you enough
Myth: If blended ROAS looks acceptable, the business is fine.
Reality: Blended ROAS can hide weak customer quality, overreliance on one channel, and poor downstream economics.
That’s why the debate in ROAS vs ROI for ecommerce growth matters. Revenue per ad dollar is useful, but it’s not the whole business. A campaign can look healthy on platform while bringing in customers who never return, buy only on discount, or produce weak AOV.
Blended reporting is convenient. It is not diagnostic. You still need to separate performance by channel, landing page, device, and customer quality.
#Myth three device performance is a minor detail
Myth: Mobile and desktop differences are just normal reporting noise.
Reality: Device gaps can hide one of the biggest leaks in the store.
A major blind spot in ecommerce analytics is the mobile-desktop gap. Mobile traffic accounts for over 60% of ecommerce sessions globally in 2025, and unoptimized mobile experiences can lead to revenue losses of 20 to 30%. If you’re looking only at blended conversion, you can miss the fact that mobile visitors are struggling while desktop props up the average.
If most of your visitors come from mobile, mobile is not a design detail. It is the store.
Use a simple comparison view:
- Bounce rate by device
- Product page engagement by device
- Checkout start by device
- Conversion by device
- AOV by device
If mobile is lagging materially, don’t jump straight to a redesign. First inspect the obvious friction points. Slow image load, sticky pop-ups, awkward variant selectors, hidden shipping info, and painful checkout inputs routinely do more damage than founders realize.
#An Actionable Workflow From Insight to Revenue
Monday morning. Revenue is down, Slack is noisy, and three people already have three different theories. One wants to cut spend. One wants to change the homepage. One thinks attribution broke.
If you handle that moment badly, you create a second problem. You pile new changes on top of the original issue, then lose the ability to tell what hurt revenue in the first place.
#The bad response many in-house teams default to
They react at the channel level because it feels fast. Paid gets paused because blended ROAS dipped. The site gets edited because conversion is down. Email gets pushed harder because it is the easiest lever to pull.
That is not a workflow. It is expensive improvisation.
The fix is to force every revenue drop through the same order of operations. Your goal is not to explain every metric. Your goal is to find the highest-dollar problem, assign a fix, and protect the rest of the business from random changes.
#The workflow that actually gets you to the right fix
Use this sequence every time:
-
Confirm the drop is real
Check tracking, site uptime, payment flow, inventory availability, and spend levels first. Founders waste hours chasing reporting errors and stockouts that have nothing to do with demand. -
Break revenue into the three drivers
Revenue moves because traffic changed, conversion changed, AOV changed, or more than one moved at once. Start there. That gives you the shortest path to the problem. -
Put a dollar value on each change
Estimate the revenue impact from each driver before you touch anything. A 15% drop in conversion usually matters more than a small traffic wobble. Prioritize by dollars lost, not by which chart looks scary. -
Localize the issue fast
Cut the data by source, landing page, device, product category, and new vs returning customers. You want to shrink the search area within minutes. -
Inspect the buying path in order
Product view to add-to-cart. Add-to-cart to checkout. Checkout to purchase. Start where money changes hands, not with broad top-funnel theories. -
Rank actions by likely payoff
Pick one immediate fix, one next fix, and one thing to monitor. If a task does not have a clear owner and expected financial upside, it should not make the list.
A simple triage view helps:
| Symptom | First place to inspect | Best first move |
|---|---|---|
| Revenue down, traffic flat | Conversion path | Review PDP friction, cart behavior, checkout errors |
| Revenue down, orders flat | AOV drivers | Check discount mix, bundles, upsells, and product mix |
| Paid efficiency down, store stable | Traffic quality | Inspect landing page match, audience targeting, creative promise |
| New customer volume up, profit weak | Customer quality | Review offer strategy, repeat rate, refund rate, and cohort behavior |
Good operators do not chase every anomaly. They fix the bottleneck with the biggest profit impact first.
That requires one discipline many founders skip. Separate diagnosis from action. Spend the first hour narrowing the cause. Spend the rest of the week fixing the highest-value issue.
Advanced analysis matters once you get past basic triage. The question is not whether a channel generated orders. The question is whether it brought in customers worth buying again. That is the standard you should use for budget decisions, merchandising decisions, and retention planning. A solid e-commerce growth strategy for Shopify brands connects those decisions so acquisition, conversion, and retention work from the same priorities.
The founders who recover fastest are usually not the busiest. They are the ones with a repeatable process. Diagnose the drop. Quantify the impact. Fix the most expensive problem first.
#Your Shopify Analytics Starter Checklist
You don’t need a fancy stack to get useful analytics in ecommerce. You need clean inputs, a short weekly routine, and enough discipline to keep looking at the same business signals in the same order.
#One-time setup
- Connect your core systems: Make sure Shopify, GA4, ad platforms, and email platform are all connected and passing clean data.
- Track the key funnel events: At minimum, capture product views, add-to-cart, checkout start, purchase, refunds, and returns if your setup allows it.
- Standardize campaign naming: If your UTM structure is messy, your reporting will stay messy.
- Build one founder dashboard: Keep it tight. Traffic, conversion rate, AOV, new vs returning customer behavior, and channel-level performance.
- Segment by device: Don’t wait until mobile becomes an obvious problem.
- Create cohort views: Even a simple monthly cohort view is better than flying blind on blended averages.
#Weekly review habit
- Review the three growth drivers: Traffic, conversion, and AOV first.
- Check what changed: Look for unusual movement by source, landing page, product, and device.
- Review customer quality: Look at retention signals and whether newer cohorts appear weaker.
- Write the top three actions: One immediate, one next, one monitor.
- Assign owners: If no one owns the fix, it won’t happen.
- Close the loop next week: Check whether last week’s action changed the underlying metric.
If you want a faster read on where Shopify’s native reporting helps and where it falls short, compare your setup against this guide to Shopify analytics alternatives and differences.
Consistent review beats heroic deep dives. The brands that grow predictably usually aren’t doing magical analysis. They’re looking at the right signals, interpreting them in context, and acting on a short list with discipline.
Arlo makes this process easier for Shopify teams that are tired of piecing together answers from multiple dashboards. Its AI marketing analyst turns store, customer, product, and marketing data into a concise weekly report that explains what changed, why it matters, and what to do next, ranked by urgency and dollar impact. If you want analytics with clear recommendations instead of chart overload, take a look at Arlo.