How to Choose an Ecommerce Analytics Platform for Shopify
By Arthur Falcone · Founder of Arlo
You're probably looking at five tabs right now. Shopify says revenue is fine. GA4 says traffic is up. Meta says your campaign is winning. Klaviyo says email is healthy. Your gut says something is off.
That's the core problem. You don't have a data shortage. You have a decision shortage.
Most founders don't need another dashboard. They need a system that tells them what changed, why it changed, and what to do next before wasted spend, weak conversion, or broken retention flows eat margin. If your reporting makes you feel busy but not clear, your analytics setup is failing its job.
This post is the buying-guide layer of our complete Shopify marketing analytics guide: how to pick the platform. Already have your stack and want to use it better? Read using ecommerce analytics day to day. Weighing specific tools against each other? The comparison pages go one by one.
#Table of Contents
- Your Shopify Store Is Talking but Are You Listening
- What Is an Ecommerce Analytics Platform Really
- The Core Capabilities Every Founder Must Understand
- How to Choose the Right Platform for Your Shopify Store
- The AI Analyst Your Analytics Platform Is Missing
- From Data Overload to Decisive Action
#Your Shopify Store Is Talking but Are You Listening
Your store is constantly sending signals. Product pages with heavy traffic but weak add-to-cart. Repeat customers buying one category but ignoring another. Mobile sessions rising while checkout completion slips. Refunds clustering around a single SKU. None of that is hidden. It's just scattered.
That's why founder-led brands get stuck. Each tool reports its own narrow truth. Shopify tracks orders. GA4 tracks web behavior. Ad platforms track platform-reported performance. Your email tool tracks opens and clicks. No one tool tells you what matters most for profit.
Practical rule: If you can't connect traffic, orders, customer quality, and channel spend in one view, you're not doing analysis. You're reading fragments.
The fix isn't to check dashboards more often. It's to stop asking vanity questions like “Did traffic go up?” and start asking operating questions:
- Which channels bring profitable customers: Not just cheap clicks.
- Where does conversion break: Homepage, PDP, cart, checkout, or post-purchase.
- Which products deserve more support: Based on actual contribution to revenue and repeat behavior.
- What changed this week that needs action: Not a monthly postmortem after the damage is done.
A useful mental model is simple. Treat analytics like an operating system, not a scoreboard. A scoreboard tells you the final score. An operating system tells your team where to act today.
Founders waste time when they admire charts instead of forcing decisions. Every report should lead to one of four actions: cut spend, increase spend, fix conversion, or improve retention. If it doesn't help you do one of those, it's probably noise.
#What Is an Ecommerce Analytics Platform Really
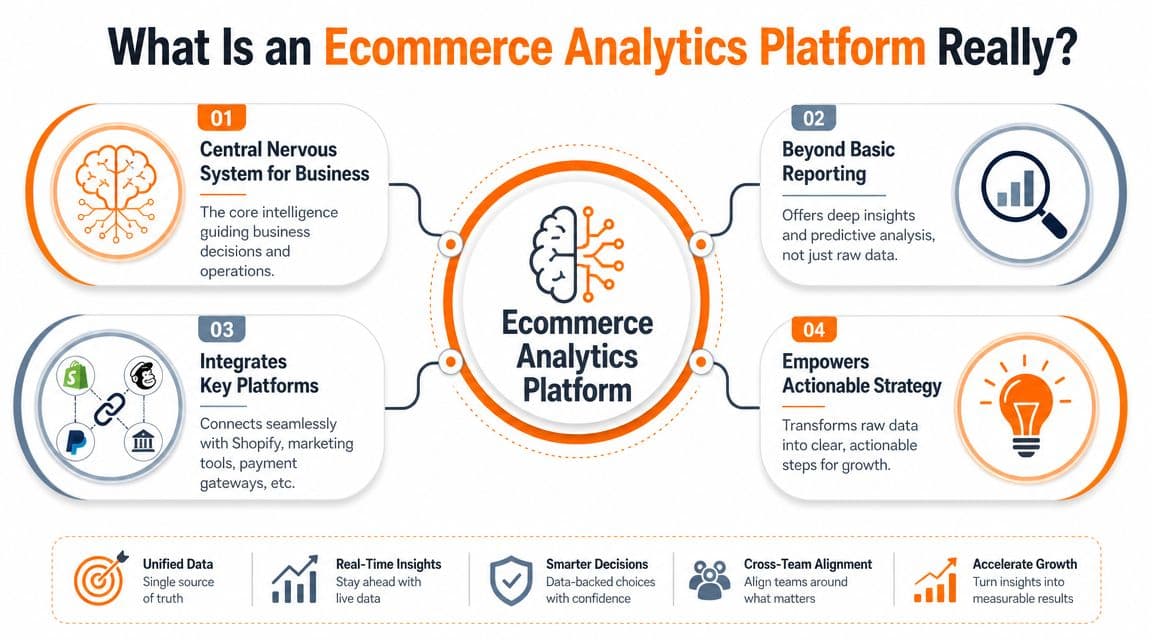
A real ecommerce analytics platform is your business's central nervous system. It pulls signals from the parts of the company that usually live in silos, then turns them into one usable picture.
#It's not a reporting tool
Most founders start with Google Analytics because it's accessible and free. That's fine. But it's not the same thing as a full ecommerce analytics platform.
Digital shopping scaled into billions of visits and transactions, which made manual reporting insufficient. Google Analytics is described as the most popular ecommerce analytics tool, used on around 31 million websites, and GA4 is free, though sampling begins above 500,000 sessions. That's one reason modern ecommerce analytics platforms are expected to consolidate website behavior, sales, traffic sources, and customer signals in one place, while tracking core metrics like conversion rate, AOV, CLV, cart abandonment, and CAC (Contentsquare on ecommerce analytics tools).
That matters because your business doesn't run on web metrics alone. If paid social drives traffic but those customers refund more, buy once, or never come back, “good acquisition” isn't good. A standalone traffic tool can't answer that cleanly.
Here's a useful comparison:
| System | What it mostly tells you | What it misses |
|---|---|---|
| Shopify reports | Sales and store-level performance | Why performance changed across channels and customer segments |
| GA4 | Web behavior and traffic patterns | Full business context beyond web behavior |
| Ad platforms | Claimed in-platform performance | Cross-channel truth and downstream customer value |
| Ecommerce analytics platform | Unified view across behavior, sales, customer, and channel signals | Only works well if data quality is reliable |
A doctor doesn't diagnose a patient by looking only at heart rate. They look at symptoms together. Your analytics platform should do the same for your business.
#The platform should unify business signals
A solid platform combines more than historical reporting. By the mid-2020s, ecommerce analytics platforms had evolved into full-stack decision systems that combine descriptive, diagnostic, and predictive analysis. They track historical KPIs such as revenue and conversion rates, compare multichannel performance, and increasingly support forecasting and personalization (Salesforce on ecommerce analytics).
That's the difference between “sales dropped” and “sales dropped because mobile PDP engagement weakened, paid traffic mix shifted, and returning customer contribution softened.”
For brands selling in newer channels, that unified view matters even more. If you're trying to understand marketplace and social commerce performance alongside your store, this guide on HiveHQ for TikTok Shop growth is a useful example of why channel-specific data needs to connect back to broader commerce decisions.
A platform worth paying for should answer questions like these without forcing you into spreadsheet cleanup:
- Acquisition: Which channels bring customers worth keeping?
- Conversion: Where are people dropping out of the funnel?
- Merchandising: Which products drive not just orders, but healthy repeat behavior?
- Retention: Which cohorts deserve more budget and attention?
- Operations: Where are stock, fulfillment, or refund patterns hurting customer value?
A strong technical setup also matters. Real-time analysis depends on a low-latency architecture with ingestion and processing, messaging between components, and an analytical database optimized for fast aggregation and calculation (Xebia on real-time analytics architecture).
#What to look for in practice
You don't need every feature under the sun. You need a platform that helps your team move faster with confidence.
Judge the platform by its output:
- Does it unify data: Web, orders, marketing, and customer signals in one model.
- Does it explain causality: Not just “what happened,” but likely drivers.
- Does it support action: Clear next steps beat endless filtering.
- Does it stay trustworthy: If connectors break, your insights are fiction.
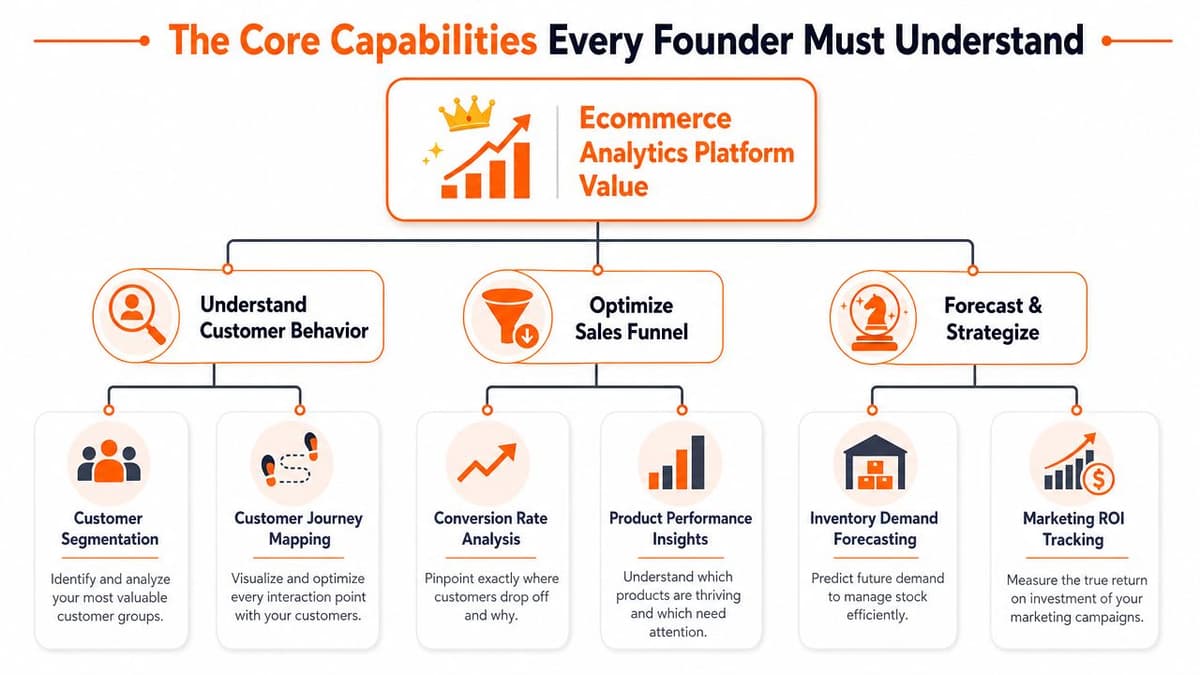
#The Core Capabilities Every Founder Must Understand
Feature lists are where bad buying decisions start. Founders see words like segmentation, attribution, forecasting, AI, and custom dashboards, then buy based on surface appeal. That's backwards. A capability only matters if it helps you answer a profitable question.
#Capability one asks better customer questions
A strong ecommerce analytics platform should help you understand who buys, how they buy, and what makes them valuable over time.
Segmentation is the obvious example, but organizations often use it poorly. They create audience slices because the tool allows it, not because the business has a real question. The right use of segmentation sounds more like this: “Do first-time buyers from paid social behave differently from first-time buyers from email capture?” That's a useful question because it affects budget and retention planning.
Customer cohorts matter for the same reason. They force you to stop treating all revenue as equal. AOV can look healthy while customer quality degrades. CLV can justify a higher CAC, but only if the platform lets you connect acquisition and retention clearly.
Good analytics doesn't just sort customers into buckets. It tells you which buckets deserve more money, more attention, or less of both.
Journey mapping also belongs here. If your customers consistently stall between product page and cart, or between checkout start and purchase, that's not a design curiosity. It's a revenue leak.
#Capability two finds revenue leaks
Here, analytics stops being decorative.
By the mid-2020s, these platforms had moved from basic traffic reporting into systems that combine descriptive analytics for what happened, diagnostic analytics for why it happened, and predictive analytics for what may happen next, often with AI-based recommendations for forecasting and personalization (Salesforce on the shift to full-stack decision systems).
That sounds abstract until you apply it:
- Descriptive: Conversion fell on mobile.
- Diagnostic: The drop was concentrated on a specific template, traffic source, or product category.
- Predictive: If the trend continues, next week's revenue mix gets weaker and your ad spend gets less efficient.
Attribution belongs in this same bucket, but only if you use it to make spending decisions. You don't need ten attribution models. You need enough clarity to decide whether to cut, hold, or scale a channel. If your team wants a practical breakdown of attribution tradeoffs, this guide on multi-touch attribution models is worth reading.
The fundamentals here are straightforward:
- Funnel visibility: You need to see product view, add-to-cart, checkout start, and purchase behavior clearly.
- Channel comparison: Not just traffic volume, but traffic quality.
- Product performance analysis: Winners, laggards, refund risk, and repeat-purchase contribution.
- Custom views: Founders, marketers, and operators need different lenses on the same business.
#Capability three helps you place better bets
The strongest platforms don't stop at diagnosis. They help you decide what to do next.
Independent guidance increasingly points toward real-time dashboards, multichannel performance comparisons, and recommendation layers that support demand forecasting and personalization. The practical implication is simple: your tool should rank problems by likely revenue impact, not dump every metric on the screen.
That matters in three common situations:
| Business question | Weak tool response | Strong tool response |
|---|---|---|
| Which channel should get more budget next month? | Shows spend and clicks | Connects spend to customer value and conversion outcomes |
| Why did sales soften this week? | Shows top-line decline | Isolates channel, device, product, or funnel drivers |
| Which products deserve merchandising support? | Shows bestsellers | Connects product demand, conversion, and downstream customer behavior |
A dashboard becomes useful when it shortens the distance between question and action. If it takes your team half a day to export, clean, reconcile, and interpret the numbers, the platform isn't saving time. It's creating expensive admin work.
#How to Choose the Right Platform for Your Shopify Store
Most software demos are theater. Clean charts. Smooth animations. A polished rep clicking through ideal data. None of that tells you whether the platform will stay reliable when APIs change, whether your team can trust the numbers, or whether anyone will use it after week two.
#Start with reliability not aesthetics
This is the most ignored buying criterion.
A major underserved angle in evaluating platforms is data quality and connector reliability. Prioritize native connectivity and connector-maintenance commitments over dashboard aesthetics, because stale or mismatched data quietly distorts spend decisions and weekly reviews.
Founders don't lose money because a dashboard is ugly. They lose money because the data is late, duplicated, misclassified, or subtly broken.
Ask blunt questions in the demo:
- What happens when an API changes: Who fixes the connector and how fast?
- How do you detect schema drift: Before or after reports break?
- How do you handle duplicate records and null values: Is that automated or manual?
- What is the latency from source to dashboard: If you're acting weekly, stale data kills confidence.
- Can the platform reconcile web, sales, and ad data clearly: Or are you still doing spreadsheet cleanup?
The prettier the dashboard, the more skeptical you should be until they prove the pipes work.
If the vendor gets uncomfortable when you ask about maintenance, reliability, or freshness, that's useful information.
#Use a founder scorecard during demos
Use this table live while the vendor is talking. Don't wait until after the call when everything sounds the same.
You can also compare what they show against your current reporting stack. If your team is still patching together reports manually, this piece on data analytic dashboards gives a useful baseline for what a more decision-ready setup should look like.
| Feature / Capability | Why It Matters | Question to Ask Vendor |
|---|---|---|
| Native connectors | Fewer fragile workarounds and less maintenance burden | Which sources do you connect to natively today? |
| Connector maintenance | Broken pipelines make every report suspect | Who maintains connectors when APIs change? |
| Data freshness | Slow data slows decisions | How quickly does source data appear in the platform? |
| Unified business view | Founders need one system across channels and store data | Can I see marketing, sales, customer, and product data together? |
| Cohort analysis | Revenue quality matters more than raw top-line sales | Can I compare repeat behavior by source, campaign, or first purchase? |
| Funnel visibility | Conversion leaks need precise diagnosis | Can I track drop-off from product view to purchase? |
| Attribution support | Budget decisions depend on channel context | How do you help teams compare channel contribution? |
| Actionability | Teams need guidance, not just charts | What does the platform do to turn insights into next steps? |
| Custom dashboards or views | Different operators need different lenses | Can founders, marketers, and ops each get relevant views? |
| Reliability alerts | Silent failure is dangerous | How do I know if a connector or data source breaks? |
A good vendor will answer directly. A weak vendor will hide behind feature breadth.
#A simple ROI lens
You don't need a complicated business case. A platform earns its keep if it helps you do at least one of these faster and more accurately:
- Lower CAC waste: By identifying weak channels, audiences, or creatives sooner.
- Improve conversion: By finding where customers stall and fixing the bottleneck.
- Increase AOV: By identifying product combinations, merchandising gaps, or audience differences.
- Protect CLV: By spotting low-quality acquisition and weak repeat behavior early.
The mistake is buying software because it can measure everything. Buy because it helps your team decide with less delay and less confusion.
#The AI Analyst Your Analytics Platform Is Missing
Even a strong ecommerce analytics platform still assumes someone on your team has time to interpret it. That's where most setups fail. The data exists, but no one turns it into a prioritized action list.
#Dashboards still require interpretation
The next step in analytics isn't more reporting. It's a layer that converts raw multichannel data into next best action.
Expert guidance increasingly emphasizes real-time, cross-channel outputs that support predictive, cognitive, and prescriptive analytics across touchpoints, with the goal of maximizing revenue through specific recommendations based on historical behavior and future predictions (OMG cloud customer architecture for ecommerce).
That's a mouthful, but the founder version is simple. You need something that can say:
- Mobile conversion slipped and the issue is concentrated on a specific template.
- Returning customer performance softened after a product mix shift.
- Paid traffic quality weakened even though platform-reported results looked acceptable.
- A key email flow deserves immediate attention before you keep spending on acquisition.
Here's what that layer can look like in practice:
#What an AI analyst should actually do
This is the missing role for many Shopify brands. Not another source of numbers. An interpreter.
A useful AI analyst should do four jobs well:
-
Surface what changed
Don't make you hunt. Flag the important shifts automatically. -
Explain why it matters
Tie the shift to revenue, efficiency, customer quality, or retention risk. -
Rank what to do first
Founders don't need ten equal-priority ideas. They need a sequence. -
Write in plain English
If the output reads like BI jargon, it's not helping.
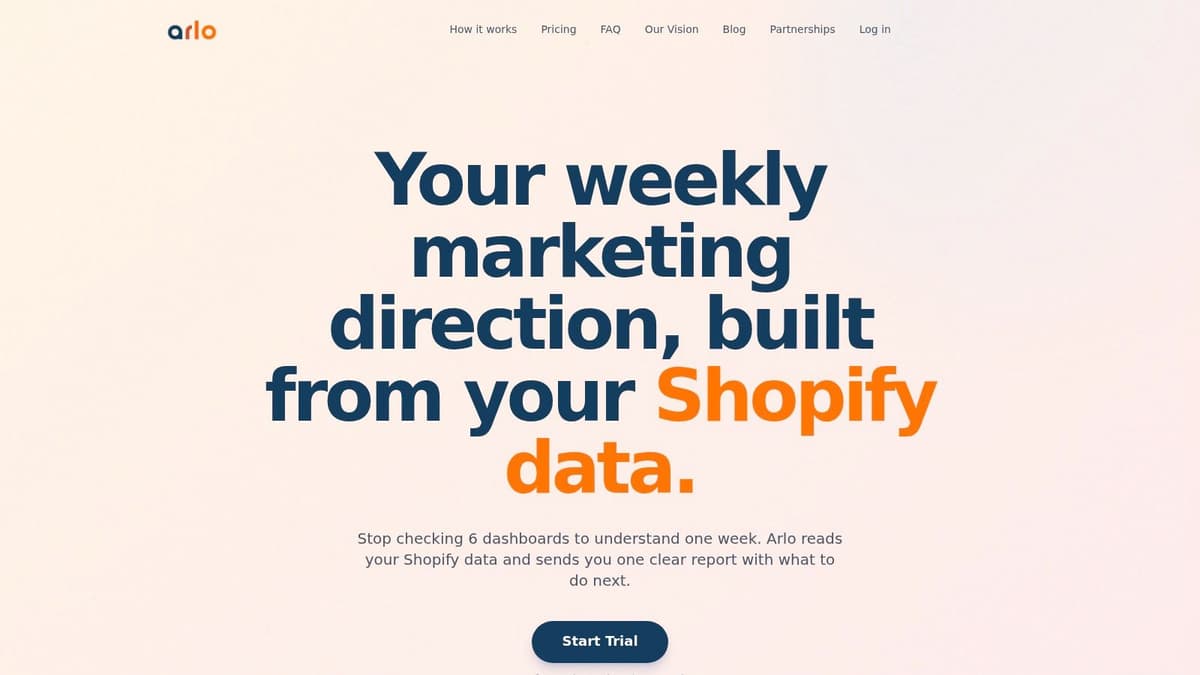
One option in this category is Arlo, which sits on top of Shopify and marketing data to produce a concise weekly report focused on what changed, why it matters, and what actions to take next. That's different from a dashboard because it reduces interpretation work instead of adding another place to check.
If your analytics tool still requires you to play detective every Monday, you don't have an insight system. You have a data storage system.
The best use of AI in analytics isn't novelty. It's triage. It helps a small team act like it has an analyst watching the business full time.
#From Data Overload to Decisive Action
A lot of brands outgrow GA4 because it only tracks web behavior. The real need is a decision-ready view that unifies marketing, sales, operations, and finance without forcing the company to become a data team (Saras Analytics on why brands outgrow GA4).
That's the standard you should use. Not “Does this platform have a lot of features?” Ask, “Does this help me make better decisions faster?”
If you sell across multiple channels, the same principle applies outside your Shopify storefront. For marketplace operators trying to understand whether they've optimized my listings on Amazon, analytics only becomes useful when listing work connects back to conversion, revenue quality, and operational follow-through.
The winning setup is usually boring in the best way. Clean inputs. Trusted numbers. Clear weekly review habits. Fast answers to obvious business questions. If you want a broader view of how teams use this kind of reporting operationally, this overview of analytics in ecommerce is a practical next read.
Stop rewarding tools for being interesting. Reward them for helping you take action.
Your time isn't best spent babysitting dashboards. It's best spent fixing leaks, backing winners, and protecting margin.
Arlo helps Shopify brands turn scattered store and marketing data into a concise weekly action report. Instead of asking you to live inside dashboards, it explains what changed, why it matters, and what to do next in plain English. You can learn more at Arlo.