Fulfillment Cost Analysis for Shopify Brands
By Arthur Falcone · Founder of Arlo
The most popular advice about fulfillment costs is to negotiate a better pick-and-pack rate. That's the wrong place to start. Before you bargain over a quoted fee, establish what you're paying to deliver an order, handle its return risk, and support the inventory behind it.
Fulfillment cost analysis should protect contribution margin, not produce a prettier warehouse quote. Start with the invoice, assign costs to the orders that caused them, and fix avoidable charges before changing providers or adding locations.
#Table of Contents
- The Lie Your Pick-and-Pack Quote Is Telling You
- Building a Fully Loaded Cost-to-Serve Formula
- Segmenting Cost by SKU, Channel, and Customer
- Returns Belong to the Original Order, Not a Separate Spreadsheet
- The Warehouse Split That Quietly Cost This Brand $41,000
- Nine Levers That Actually Lower Cost per Order
- Turning Cost-to-Serve into a Pricing and Merchandising Decision
#The Lie Your Pick-and-Pack Quote Is Telling You
A pick-and-pack quote tells you what a provider charges for a defined activity. It doesn't tell you what your customer's order costs to fulfill.
The reported average DTC pick-and-pack fee of $3.21 for a one-item order excludes receiving, storage, returns, cartons, account management, setup, and minimum fees, according to KSP's fulfillment-cost benchmark breakdown. Treat that figure as a component benchmark, not a budget.
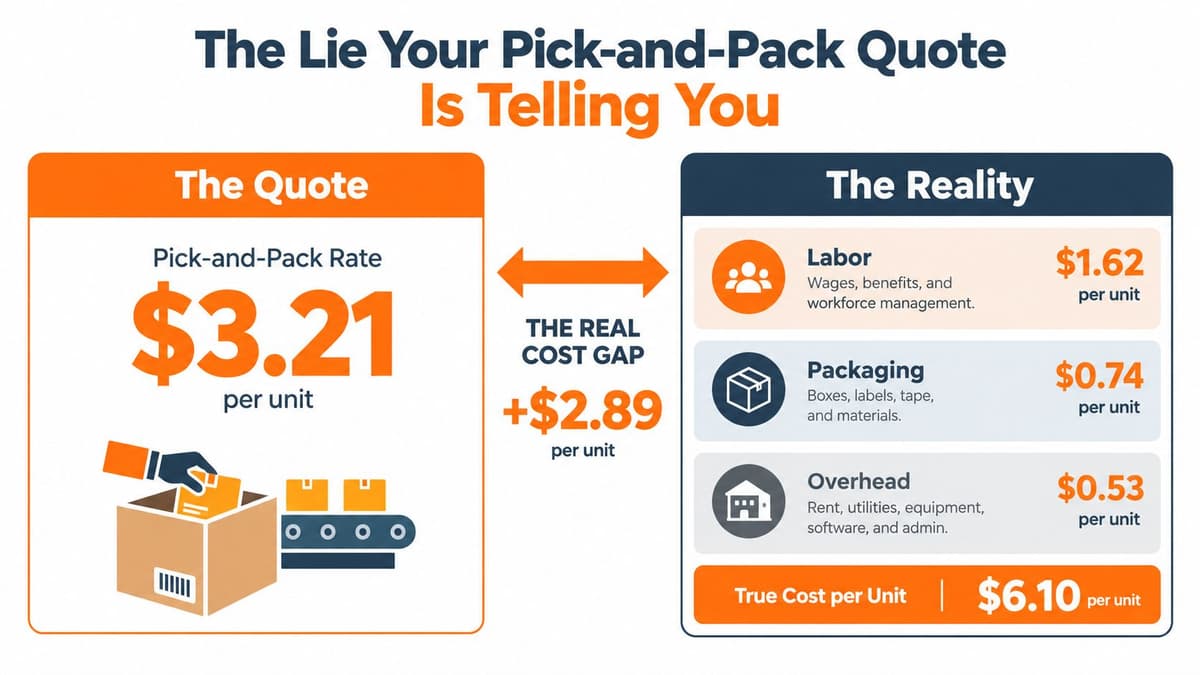
The visual illustrates the distinction between a quote and a loaded cost. It isn't a universal conversion between the amounts shown. Your actual gap has to come from your contract and invoices.
#Compare the service boundary, not the headline
Brands with identical pick fees can have very different economics. A compact product that sells quickly doesn't consume the same storage capacity as a bulky product that sits, needs protective packaging, and requires special handling.
Ask your provider to identify precisely what the quoted activity includes:
- Packing materials: Are cartons, mailers, tape, inserts, and protective fill included?
- Order complexity: What triggers extra picks, kitting charges, or handling fees?
- Account charges: Which technology, administration, onboarding, and minimum charges sit outside the quote?
- Exceptions: What happens when inventory arrives incorrectly labeled or an order needs rework?
Don't assume an excluded fee is unfair. Receiving and storage are real services. The problem is comparing providers without putting those services inside the same boundary.
Practical rule: Never negotiate a unit rate until you can reconcile the full invoice to the activities your business generated.
#Defend the margin that remains
Your decision metric should be contribution margin after fulfillment: selling revenue minus product cost, acquisition cost, outbound fulfillment, expected returns, and relevant payment charges. Shopify's fulfillment-cost analysis supports treating fulfillment as a multi-component expense rather than shipping alone.
Keep the accounting boundary consistent. If your finance team includes a payment expense elsewhere, don't deduct it again. If you allocate warehouse overhead into fulfillment, don't exclude it when evaluating a replacement provider.
The cheapest quote isn't necessarily the cheapest operating model. Your task is to identify which provider, process, and product mix leaves the most contribution after the customer has been served.
#Building a Fully Loaded Cost-to-Serve Formula
Build the spreadsheet around activities, not invoice labels. Providers use different names for similar services, so map each charge into a consistent category before comparing anything.
Fully loaded cost per order = (direct labor + packaging + carrier charges + warehouse space + receiving + inventory handling + technology + returns processing + allocated overhead) ÷ fulfilled orders.
For outsourced fulfillment, use the invoiced service charges representing those activities. Don't add the provider's underlying labor or rent again.
#Fully loaded cost-to-serve components
| Cost component | What it covers | Common driver | Question to verify on your invoice |
|---|---|---|---|
| Direct labor | Picking, packing, and special handling | Orders, picks, labor minutes | Which activities trigger additional charges? |
| Packaging | Cartons, mailers, protection, inserts | Package type and usage | What's included in the base service? |
| Carrier charges | Outbound transportation and adjustments | Billed weight, zone, service | Can each charge be traced to a shipment? |
| Warehouse space | Inventory storage | Pallets, bins, cubic volume, days | How is occupied space measured? |
| Receiving | Unloading, counting, and putaway | Pallets, cartons, units | Are exception charges separate? |
| Inventory handling | Transfers, replenishment, rework | Movements and labor time | Which movements are billable? |
| Technology | Systems and integrations | Account or connection | Is this already bundled? |
| Returns processing | Inspection and disposition | Returns and service required | What does the processing fee exclude? |
| Allocated overhead | Relevant support and administration | Documented allocation basis | Is the allocation consistent? |
#Work the order mix without inventing rates
For 500 one-item orders, an average pick-and-pack charge of about $3.20 produces approximately $1,600 in picking charges before other services; the same pricing overview reports pallet storage around $20.17 monthly and receiving around $10.50 per pallet, with shipping separate and monthly minimums common (Extensiv's 3PL pricing breakdown).
That's a starting subtotal, not the answer. Add actual pallet-months, received pallets, packaging, postage, account charges, and applicable minimum top-ups, then divide by fulfilled orders.
For three-item orders at the same order volume, keep the first-item charge and add the contracted additional-pick charges. Recalculate package requirements and shipping from the resulting parcels. Don't multiply the entire one-item fulfillment cost by the item count: order-level charges and item-level charges behave differently.
A monthly minimum also needs interpretation. Determine whether it replaces eligible activity charges when spending falls short or applies as an additional account charge.
For marketplace-specific modeling, keep Reddog Consulting Group's Amazon fulfilment costs guide alongside the relevant fee schedule. Use a consistent ecommerce analytics framework to join invoice lines, orders, shipments, and inventory movements rather than maintaining disconnected totals.
#Segmenting Cost by SKU, Channel, and Customer
A blended cost per order is useful for reconciliation. It's a weak merchandising tool.
You need to know which products consume warehouse capacity, which destinations require expensive services, and which channels retain contribution after their fulfillment requirements. Otherwise, you'll negotiate across the account while leaving the expensive segments untouched.
#Assign costs according to what caused them
Use activity-based allocation rather than spreading every expense evenly across orders. HireAccountants' founder's guide to cost allocation is a useful companion when choosing allocation methods.
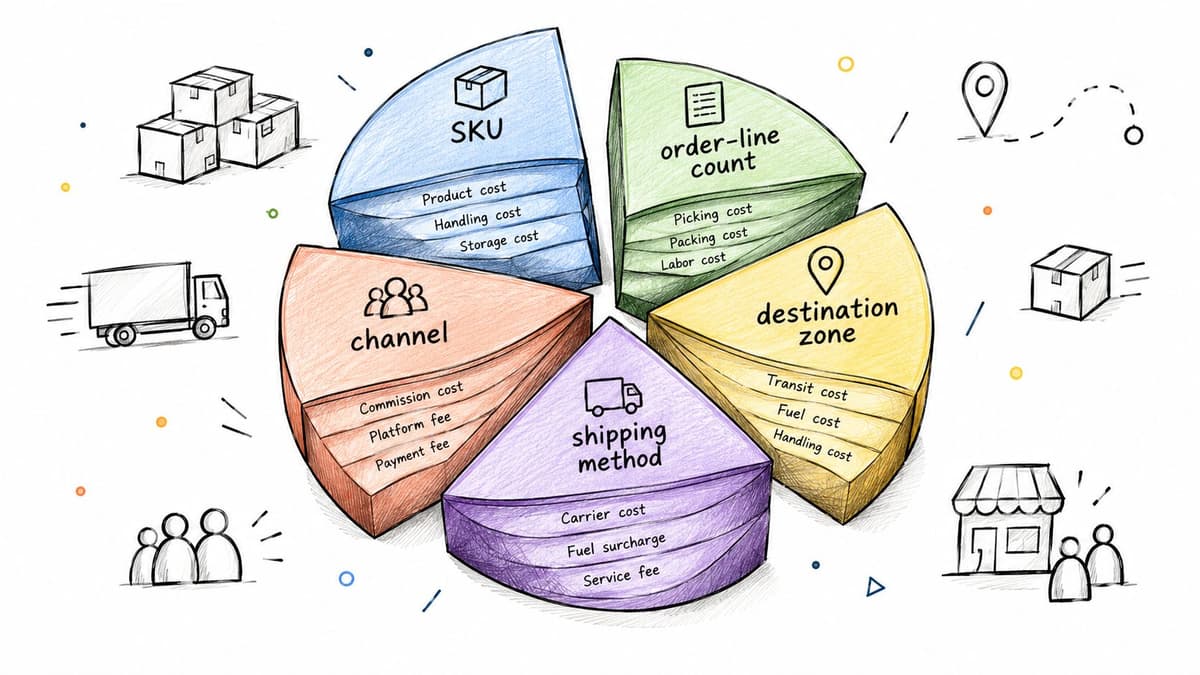
Build a report with these dimensions:
- SKU and product family: Separate product-specific handling, packaging, and storage requirements.
- Order-line count: Distinguish simple orders from orders requiring more picking activity.
- Destination and shipping method: Keep geography separate from the customer's selected service.
- Channel: Compare Shopify, Amazon, and wholesale using their actual operating requirements.
- Customer segment: Assess service demands and return behavior without treating every customer as interchangeable.
Trace directly attributable charges first. Allocate shared costs only after that, using a documented driver such as occupied volume, storage duration, or handling time.
#Equal revenue doesn't mean equal contribution
Consider an illustrative comparison of products generating equal revenue. A small accessory moves through standard packaging. A bulky product requires more space and a larger parcel. A fragile product needs protective materials and inspection.
| Illustrative product | Cost exposure to investigate | Decision the report should support |
|---|---|---|
| Compact accessory | Shared order costs and additional picks | Whether bundling improves contribution |
| Bulky product | Storage volume and parcel dimensions | Whether price covers space consumption |
| Fragile product | Protection, handling, and damage-related work | Whether packaging or assortment should change |
These aren't claimed brand results. They're the comparisons your own order data should resolve.
Rank SKUs by fulfillment cost relative to selling revenue, then inspect contribution dollars alongside that ratio. A costly product can still be attractive if its selling economics support the service requirement. A cheap-to-ship product can still be unattractive after acquisition expense.
Connect the report to inventory optimization decisions. Keep separate views for product profitability and inventory commitment: a product's contribution per sale doesn't tell you whether holding its inventory is a good use of cash.
#Returns Belong to the Original Order, Not a Separate Spreadsheet
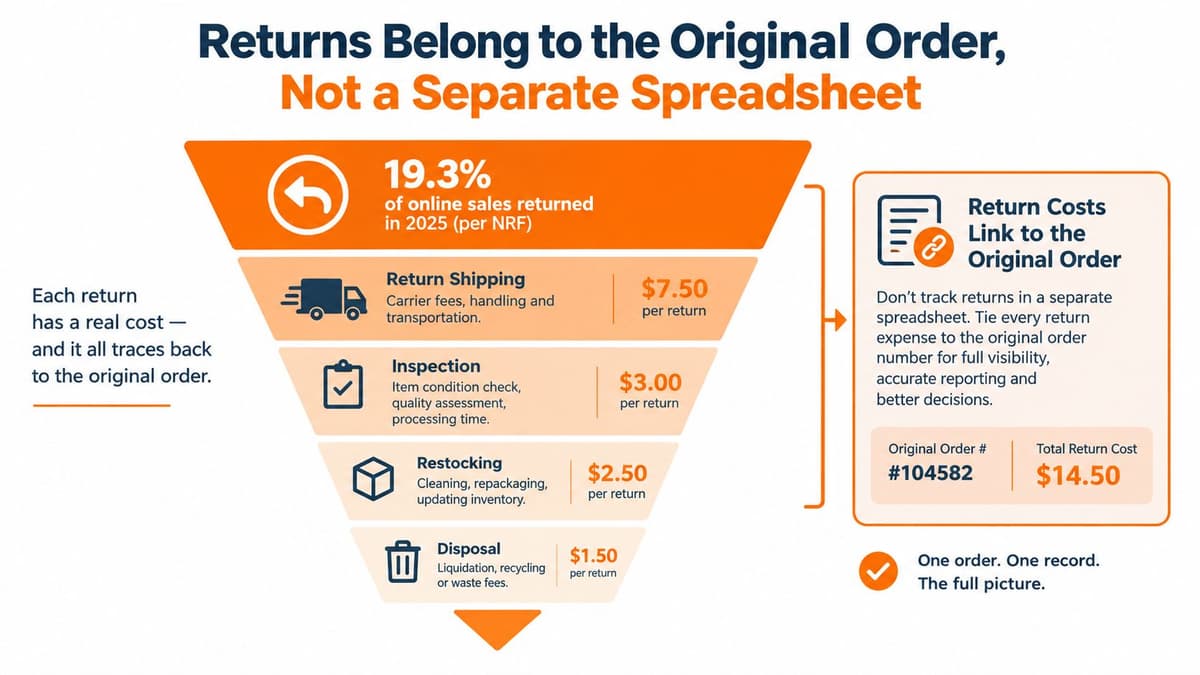
The National Retail Federation estimated that 19.3% of online sales were returned in 2025, with approximately $849.9 billion in merchandise returns across retail, according to its retail returns announcement. The online percentage and total retail merchandise value have different scopes. Don't combine them into a fabricated online-loss estimate.
For your store, the actionable question is narrower: what return burden should you assign to an order when you accept it?
#Build an expected-cost allowance
A survey of more than 600 warehouses reported average returns processing of $4.06; using a 17% return-rate assumption, that processing fee alone contributes approximately $0.69 per original order, before other return expenses (Fulfill's warehouse pricing analysis).
That calculation is a sensitivity example, not a recommendation to use a market average instead of your own return history. Apply your SKU or category return probability to the costs you incur.
| Returns contribution input | What to capture | Modeling treatment |
|---|---|---|
| Reverse shipping | Labels and carrier adjustments | Expected cost per original order |
| Inspection labor | Checking, grading, and documentation | Include only what isn't already bundled |
| Repackaging | Replacement materials and preparation | Assign to returned products |
| Refund payment fees | Charges retained or triggered | Use actual processor terms |
| Markdown or write-off | Loss relative to recoverable inventory value | Avoid duplicating product-cost losses |
| Inventory downtime | Time unavailable for resale | Track consistently with carrying costs |
| Customer service | Return-related support effort | Allocate using documented activity |
Expected return burden = return probability × expected incremental loss and processing expense per return.
Refund accounting needs particular care. If your revenue is already net of refunds, don't subtract the refunded selling price again. Likewise, resale recovery shouldn't become an extra credit if your inventory accounting already recognizes the restored stock.
A cheaper outbound provider isn't cheaper overall if its operating process leaves you with more damaged stock, slower restocking, or less recoverable inventory.
#Manage returns as a product decision
Join returns to original order IDs and SKUs. Record return reasons, processing dates, disposition, and recoverable value so finance and operations can evaluate the same transaction.
Then compare policies and providers on total contribution, not return fees alone. Faster inspection is valuable only when it improves something economically useful, such as making saleable stock available sooner. Ask providers to explain that workflow before accepting a low processing quote.
#The Warehouse Split That Quietly Cost This Brand $41,000
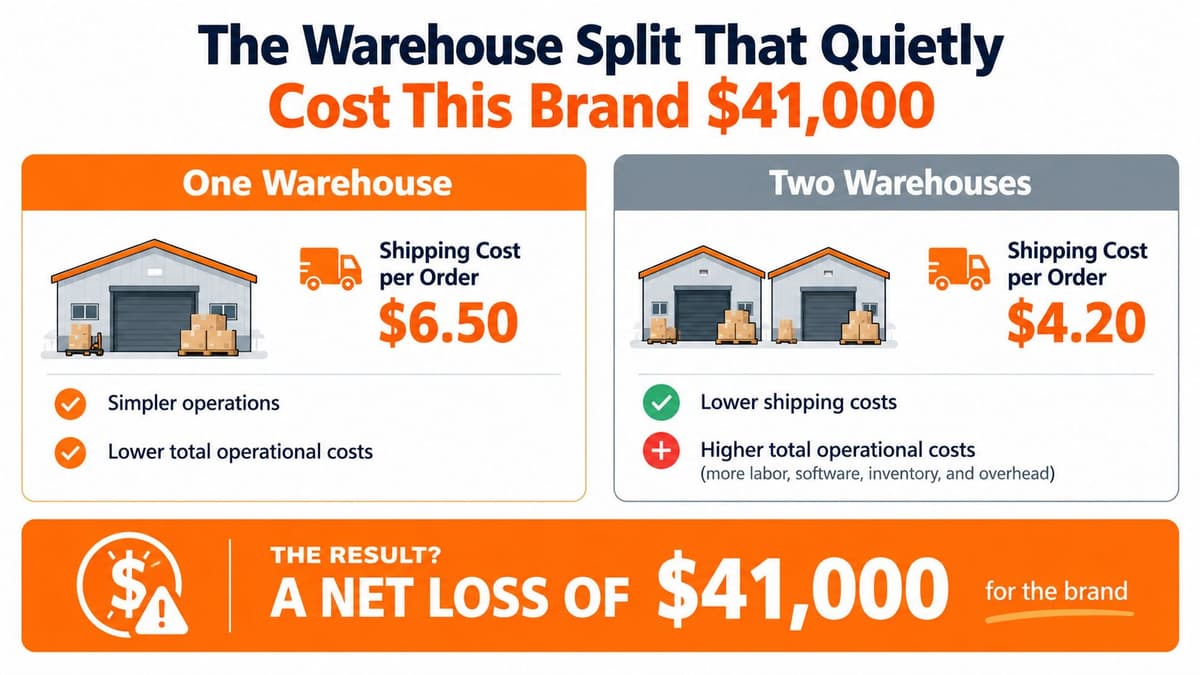
Adding a warehouse can reduce shipping expense and still make the operation more expensive. Don't approve a location because the parcel-rate comparison looks attractive.
A 2025 industry comparison, rather than an independently documented brand audit, modeled shipping falling from $70,000 to $63,000, approximately 10%, while total annual cost rose from about $160,000 to $201,000. The resulting $41,000 increase reflected higher storage, inbound freight, inventory carrying, labor, and systems costs (eFulfillment Service's inventory-splitting comparison).
#Calculate the break-even from total incremental cost
The useful equation is:
Break-even regional order volume = incremental regional operating cost ÷ net savings per eligible regional order.
Calculate incremental operating cost after accounting for costs removed from the original facility. Include duplicated inventory carrying expense, additional minimums, inbound freight, transfers, administration, and systems.
For the denominator, use shipping savings after regional handling differences and other incremental per-order charges. If that figure isn't positive, additional order volume won't rescue the proposal.
Don't spread the assumed savings across your entire catalog. Only count orders that the regional facility can fulfill with the planned inventory.
#Test placement at the SKU level
Fast-moving products with concentrated regional demand are better candidates for a placement test than a long tail with scattered demand. Keep slow movers centralized unless their own economics justify duplication.
Before signing, require answers to these questions:
- Demand concentration: Which products generate repeatable demand near the proposed location?
- Service promise: What delivery improvement are customers receiving?
- Replenishment: Can suppliers feed the location economically and reliably?
- Stock imbalance: What happens when one warehouse sells out while another holds excess?
- Transfers and exit: Who pays to rebalance or remove inventory?
- Obsolescence: What additional stock could require markdown or disposal?
Treat any claimed conversion or retention benefit from faster delivery as a separate hypothesis. Don't insert an unsupported revenue uplift into the savings calculation to make the contract work.
A regional trial should have a defined SKU list, cost boundary, and exit condition. Expanding a proven placement is a better decision than duplicating the catalog and hoping shipping savings cover the rest.
#Nine Levers That Actually Lower Cost per Order
Start with invoice clarity and packaging, not a network redesign. That's my recommended effort-to-impact order: resolve billing ambiguity and physical inefficiency before taking on migration work or inventory duplication.
There's no honest universal savings percentage for these levers. Use the affected spend on your own invoice as the opportunity ceiling, then subtract implementation costs and any service trade-off.
#Fulfillment-cost reduction levers ranked by effort and impact
| Lever | Question to ask | Typical impact |
|---|---|---|
| Itemize invoices and challenge minimums | What spending qualifies toward the minimum? | Low effort; exposes avoidable top-ups and discrepancies |
| Audit packaging dimensions | Does billed size match the packed product? | Can affect both materials and transportation |
| Review aged inventory | Which products occupy paid space without moving? | Targets continuing carrying expense |
| Renegotiate receiving and returns | Which exception charges can better procedures remove? | Reduces cost where repeatable activity exists |
| Centralize low-velocity SKUs | Where are we duplicating weak demand? | Limits fragmented stock and location charges |
| Test regional carriers or zone-skipping | Which dense lanes support an alternative? | Lane-specific opportunity, with service constraints |
| Change storage pricing structure | Are we paying for unused allocated space? | Useful when the current billing unit mismatches inventory |
| Bundle slow movers | Does the bundle retain contribution after handling? | Can release inventory and space |
| Review payment-related charges | Which charges vary by order value or refund? | Clarifies net order economics |
#Turn each lever into a measurable test
For invoice minimums, inspect eligible spending, the minimum threshold, and the top-up billed. Challenge interpretation errors before requesting a discount.
Measure packed dimensions for the packaging audit, then compare actual billed dimensions and weight. Smaller packaging isn't a win if it increases damage or rework.
For aged inventory, create age buckets and inspect surcharge conditions. Amazon's published UK policy illustrates the specificity: qualifying conditions include a Professional account, inventory first received more than 365 days earlier, at least 0.71 cubic meters of relevant average daily inventory, and a utilization ratio above 22 weeks (Amazon's storage policy). Don't apply those rules universally to other providers.
Receiving and returns negotiations should focus on chargeable exceptions and service scope. Ask whether accurate labels, advance shipment information, or standardized return grading can remove billable work.
Centralization tests should track transfers and location minimums. Carrier trials need lane-level postage, claims, and service results. Storage-model comparisons need measured occupied volume, not unit counts.
For bundles, calculate the incremental picks, packaging, discount, and expected return treatment. For payments, reconcile processor charges against transaction and refund records rather than assuming the advertised rate is the effective cost.
Execution order: Fix billing first, change repeatable workflows next, and reserve structural changes for opportunities your data can defend.
Use a 30-60-90-day implementation plan: reconcile and measure first, negotiate and pilot next, then scale validated changes. Keep the plan tied to broader ecommerce cost-reduction strategies, but assign an owner and a measurable acceptance condition to every fulfillment experiment.
#Turning Cost-to-Serve into a Pricing and Merchandising Decision
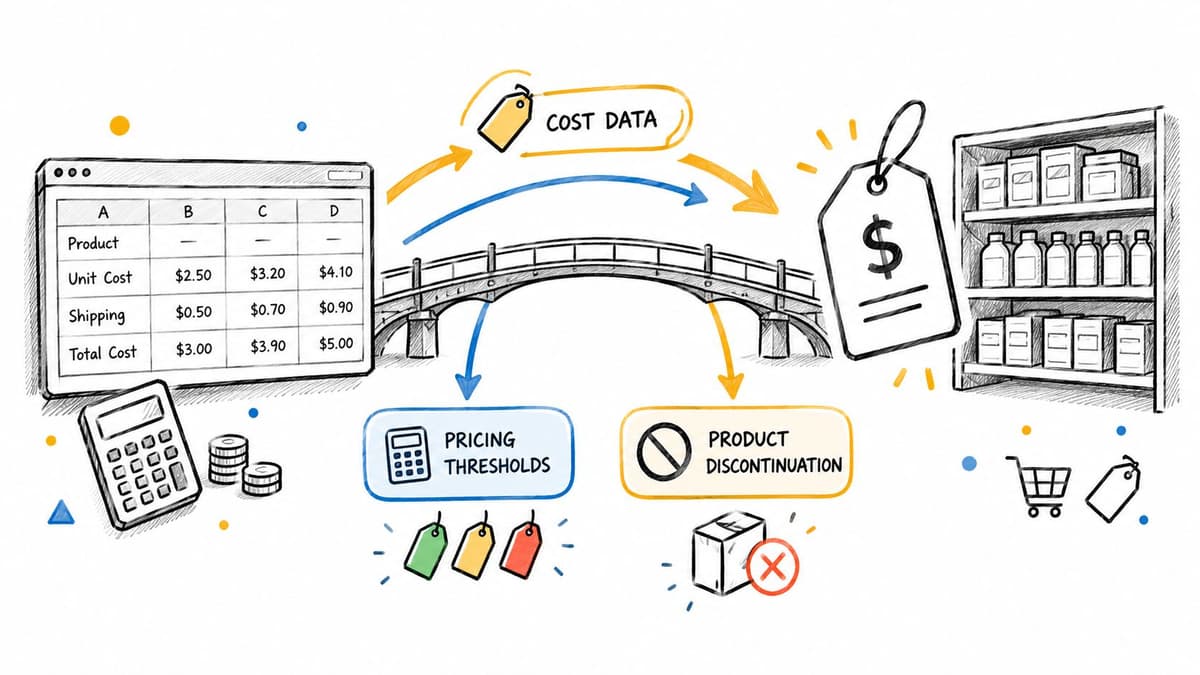
Cost-to-serve analysis earns its place when someone changes a decision. Use it to set prices, stop replenishing unattractive products, adjust channel assortment, and prepare for fee changes.
A product with weak contribution doesn't automatically need discontinuation. Test whether price, packaging, purchase quantity, or service promise can repair its economics before removing it.
#Keep fee assumptions dated
Amazon states that products priced under $10 receive Low-Price FBA rates $0.86 lower than rates for products priced above that threshold. It also announced a 3.5% fuel and logistics surcharge beginning April 17, 2026, for US and Canadian FBA and specified remote-fulfillment destinations, with covered holiday peak fees scheduled for October 15, 2026 through January 14, 2027 (Amazon's fulfillment fee announcement).
Those are dated rules, not evergreen assumptions. Confirm the applicable marketplace, program, size tier, and effective date before approving a price change.
Maintain distinct scenarios:
- Normal season: Use the applicable base fee schedule and ordinary operating assumptions.
- Peak season: Apply relevant seasonal charges and the expected order mix.
- Surcharge-adjusted: Isolate announced changes so you can see their contribution impact.
A higher selling price can improve revenue while changing fee eligibility. Compare incremental gross profit with incremental fees rather than assuming every price increase improves contribution equally.
#Put the result on the operating agenda
Review negative-contribution products with merchandising, not just finance. Give operations responsibility for service-cost exceptions and give channel owners responsibility for channel-specific economics.
A contribution-margin-after-fulfillment number, refreshed quarterly and whenever material fees change, is your best defense against a great-looking P&L built on unprofitable orders.
Arlo offers an AI-powered marketing analyst for Shopify merchants, turning sales, customer, traffic, and product signals into a concise weekly “20 Minute CMO” report with prioritized actions. Pair your fulfillment economics with clearer growth decisions: visit Arlo to see how its reports help you identify what changed, protect what's working, and choose what to do next.