
Shopify Performance Benchmarking: Unlock Growth 2026
By Arthur Falcone · Founder of Arlo
You're probably looking at Shopify, GA4, Meta Ads, Klaviyo, and maybe a spreadsheet you stopped trusting two months ago. Sales moved. Conversion dipped. Mobile feels weak. Paid spend looks expensive. You have data everywhere and clarity nowhere.
That's the trap. Most founders don't have a data problem. They have a context problem. A dashboard tells you what happened. A benchmark tells you whether it's good, bad, noisy, or worth fixing. If you skip that step, you end up reacting to random swings, chasing the wrong bottleneck, and burning time on changes that don't move revenue.
#Table of Contents
- Why Your Shopify Store Needs a Benchmark Not a Dashboard
- Define Your Core Metrics Before You Collect Data
- Establish Your Baseline and Find Your Competitors
- How to Read the Gaps Between Your Store and the Benchmark
- Estimate Revenue Impact and Prioritize Your Fixes
- Make Benchmarking a Rhythm Not a One-Time Project
#Why Your Shopify Store Needs a Benchmark Not a Dashboard
A lot of founders think the answer is more reporting. It isn't. More charts just give you more ways to panic.
If your dashboard says conversion is down, what are you supposed to do with that? Nothing, until you know whether the drop is normal for your store, normal for your category, isolated to one device, or tied to a specific funnel break. Raw numbers without a reference point are just mood swings with decimals.
That's why performance benchmarking matters. It gives your metrics a standard. Once you have that standard, the conversation changes from “why is this number ugly?” to “which gap is costing us money?”
Practical rule: If a metric can't be compared against your own baseline or a credible peer benchmark, it shouldn't drive a major decision.
A benchmark also keeps you from worshipping dashboards that were never built for prioritization. Most analytics setups are good at collection and bad at judgment. They show traffic, orders, sessions, and slices of attribution. They rarely tell you which issue deserves your next hour. If you want a good example of why dashboards often create more noise than insight, read this take on the limits of a data analytics dashboard.
#Dashboards report activity, benchmarks support decisions
Here's the difference in plain English:
| View | What it tells you | What it misses |
|---|---|---|
| Dashboard | What changed | Whether the change matters |
| Benchmark | How current performance compares to a standard | Why the gap exists |
| Action plan | What to fix next | Whether the fix is worth the effort |
Founders usually skip the middle row. That's where most wasted effort starts.
#Benchmarks reduce bad reactions
You don't need more KPIs. You need fewer, cleaner comparisons. For technical performance work, rigorous benchmarking means using a minimum six-month window of historical data and tracking baseline measures before making comparisons, according to this guidance on benchmarking in IT performance metrics. The principle matters for Shopify brands too. Don't compare this week to your emotions. Compare it to stable history.
A benchmark is what stops you from pausing a channel that's fine, redesigning a product page that isn't the issue, or blaming creative when your mobile checkout is leaking buyers.
#Define Your Core Metrics Before You Collect Data
Most brands overcomplicate this part. They build a monster KPI sheet, then ignore half of it by next month. Keep it tight.
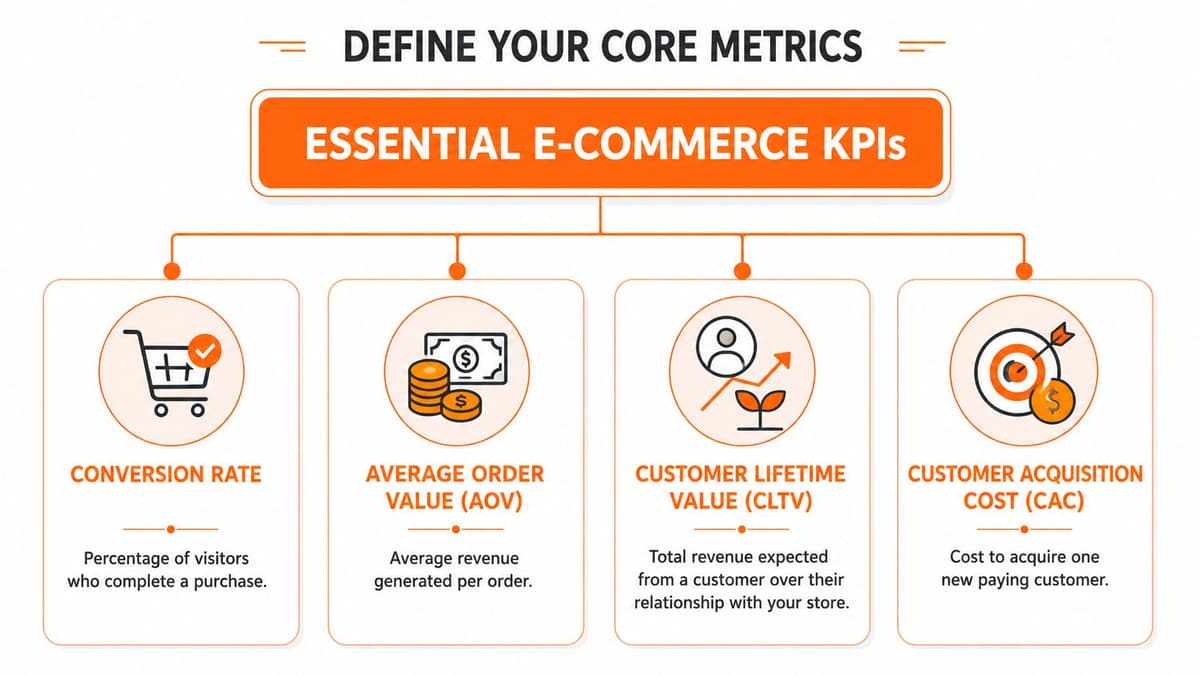
Actionable benchmarking requires collecting internal baseline data on four core metrics: Average Order Value (AOV), Customer Acquisition Cost (CAC), conversion rates, and Customer Lifetime Value (CLV) using Shopify Analytics, Google Analytics 4, or your CRM before comparing against industry averages, as outlined in this guide to performance benchmarking for ecommerce brands.
#Start with four metrics that matter
These four metrics give you the fastest read on business health.
-
Conversion rate tells you whether your traffic turns into orders. Pull it from Shopify Analytics and validate behavior patterns in GA4. If conversion weakens while traffic quality looks stable, your site or checkout usually deserves scrutiny first.
-
AOV tells you how much each order is worth. This is your read on merchandising, bundling, pricing presentation, and upsell quality. If conversion is flat but revenue is soft, AOV may be the real issue.
-
CAC tells you what you're paying to acquire a customer. Pull this from your ad platforms and finance reporting, then sanity check it against channel mix. If you can't understand marketing attribution ROI, your CAC number will look cleaner than reality.
-
CLV tells you whether your acquisition engine has any business buying power behind it. Subscription brands, replenishment brands, and high-repeat categories should care about this more than vanity growth screenshots.
If you want a practical scorecard for what to track as a growing brand, this guide to KPIs for ecommerce is useful because it keeps the list closer to reality.
#Add operating thresholds for store performance
Revenue metrics tell you what the business did. Site performance metrics tell you whether the customer journey is physically capable of converting.
For ecommerce performance, founders should set explicit thresholds for page load times under 2 seconds, error rates below 1%, and checkout success rates above 95% during key journeys, based on this guidance for ecommerce performance testing. Those are not “nice to have” targets. They're the line between a store that can handle intent and a store that wastes it.
Use a simple scorecard like this:
| Metric | Why it matters | Where to check |
|---|---|---|
| Conversion rate | Measures how efficiently traffic becomes revenue | Shopify Analytics, GA4 |
| AOV | Shows order value quality | Shopify Analytics |
| CAC | Shows acquisition efficiency | Meta Ads, Google Ads, blended reporting |
| CLV | Shows customer value over time | CRM, subscription platform, retention reporting |
| Page load | Affects user experience and drop-off | Site speed tools, monitoring tools |
| Error rate | Flags broken journeys | Monitoring tools, platform logs |
| Checkout success | Protects the final revenue step | Shopify checkout reporting |
Don't track twenty metrics badly. Track a handful well enough that someone can act on them this week.
#Establish Your Baseline and Find Your Competitors
The fastest way to sabotage performance benchmarking is comparing yourself to the wrong thing. The second fastest is using your own messy data as if it's clean.
#Build an internal baseline you can trust
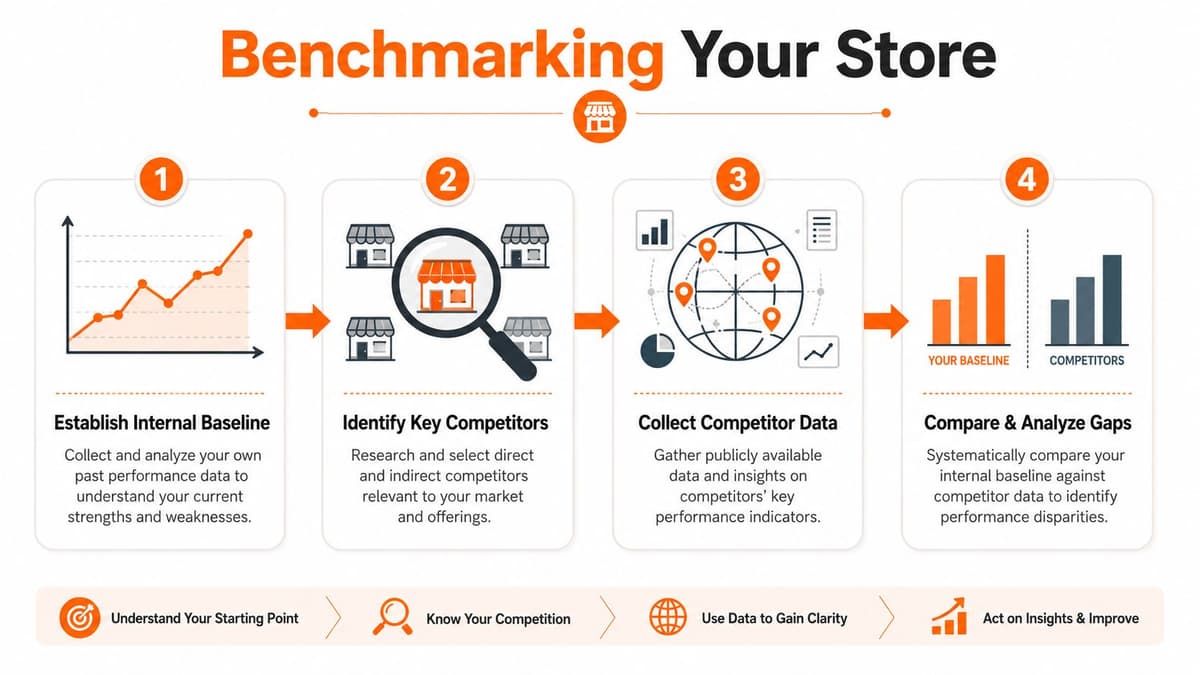
Start with your own store. External benchmarks are useful, but your first job is knowing what “normal” looks like for you.
For rigorous benchmarking, you want a minimum six-month window of historical data before making comparisons, according to this practical overview of benchmark testing methodology. In technical testing, the same methodology also calls for at least 5 identical iterations and a coefficient of variation threshold of 5%, with 10+ iterations for high-stakes decisions. The ecommerce lesson is straightforward. Don't call something a trend because you saw it twice.
Your baseline should exclude obvious distortions where possible. Flag major promos, product drops, stockouts, and one-off campaigns. If a weekend flash sale crushed your normal AOV or conversion pattern, keep the data but label it. Unlabeled data is how founders talk themselves into bad conclusions.
Use this sequence:
- Pull six months of data from Shopify, GA4, and your CRM.
- Normalize by week and device so mobile and desktop don't blur together.
- Mark unusual periods such as launches, heavy discount windows, or operational incidents.
- Lock your metric definitions so conversion, CAC, and CLV mean the same thing every time you review them.
A baseline is only useful if the definitions stay fixed. Changing the formula every month is just cleaner chaos.
#Choose peers that are actually relevant
Most founders benchmark against brands they admire. That's a mistake. Benchmark against brands your customers could realistically choose instead.
A globally recognized framework for competitive analysis recommends selecting 5–8 primary metrics and defining scope with a precise four-digit NAICS code rather than a broad sector, which creates cleaner peer groups, as explained in this overview of competitive benchmarking. The exact code matters more in broader industry analysis, but the operating principle applies neatly to DTC. Tight peer groups beat broad category labels.
For Shopify brands, your peer set should match on:
- Product category. Skincare shouldn't benchmark against furniture.
- AOV range. Low-ticket impulse brands live in a different world than considered-purchase brands.
- Primary geography. Shipping speed, payment preferences, and demand patterns shift by market.
- Business model. Subscription, one-time purchase, and replenishment brands behave differently.
If you're evaluating platform decisions while doing this work, especially in a regional context, this comparison of Shopify vs WooCommerce for Australian stores is useful because platform architecture can affect what data you can access cleanly and how quickly you can act on it.
For positioning work, this article on competitive positioning helps tighten who you should compare against.
#Don't trust benchmark headlines at face value
Vendor studies love clean wins. Your store lives in a messier world.
One overlooked issue is the cold-start artifact in ecommerce analytics, where new data pulls can inflate variance by 15–25% before reaching steady state, as discussed in this piece on software performance benchmarks. The same source also notes that vendor benchmarks can inflate performance by 20% in single-vendor studies. That's why you should treat shiny benchmark claims like ad creative. Interesting, not authoritative.
Use external benchmarks to frame the question. Use your own baseline to make the decision.
#How to Read the Gaps Between Your Store and the Benchmark
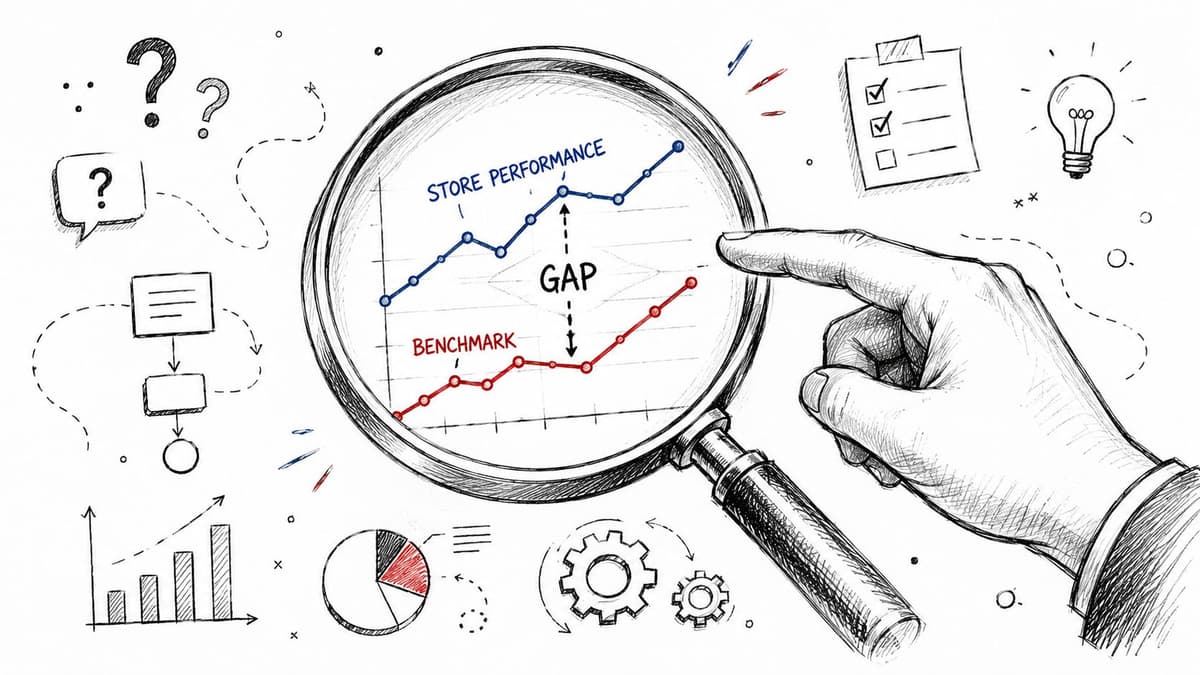
A benchmark gap is not a diagnosis. It's a flare.
If your store underperforms a benchmark, the number itself doesn't tell you what broke. It only tells you where to investigate.
#Treat every gap like a symptom
Here's the operator mindset that works:
| Symptom | Possible cause | First place to look |
|---|---|---|
| Low conversion | Slow pages, weak offer clarity, poor mobile UX, checkout friction | Device split, page speed, funnel steps |
| High CAC | Bad targeting, poor landing page fit, weak creative-to-page match | Channel mix, landing page behavior |
| Low AOV | Weak bundles, poor merchandising, discount structure | Cart composition, product mix |
| Soft CLV | Poor post-purchase flows, weak replenishment, low repeat intent | CRM, cohort behavior, email and SMS flows |
Founders often overreact at this point. They see low conversion and immediately rewrite the product page. Maybe that's right. Maybe mobile page speed is the main leak. Maybe checkout errors are doing the damage. Maybe your paid team is sending low-intent traffic and your site is innocent.
Don't fix the visible page first. Fix the proven bottleneck first.
#Mobile usually tells the truth faster
Emerging data from the last 12 months shows that 78% of Shopify merchants fail to close mobile–desktop performance gaps because they benchmark desktop conversion rates while ignoring mobile p95 latency, according to this resource on performance benchmarking. That's one of the most common founder mistakes I see in practice. Desktop looks acceptable, so the team assumes the site is fine.
It isn't fine if paid social traffic lands on a slow, clumsy mobile experience.
Start every diagnosis with a split like this:
- Device split. Compare mobile and desktop conversion, add-to-cart rate, and checkout completion.
- Visitor type. Compare new and returning visitors. If returning buyers convert fine and new visitors don't, the issue may be trust, clarity, or landing page fit.
- Traffic source. Paid social, branded search, email, and direct traffic behave differently. Don't blend them and pretend the average means something.
- Journey step. Product view, add-to-cart, checkout start, checkout completion. The drop point matters more than the headline metric.
This walkthrough is worth watching if you want another lens on diagnosing the right metric breaks:
#Separate noise from a real problem
Some performance changes are real. Some are just messy data wearing a costume.
To identify the highest revenue impact opportunity, operators should document their current device split, add-to-cart rate, and conversion rate, then calculate gaps against industry averages and focus the next 90-day improvement plan on the biggest one, as outlined in this guide to ecommerce benchmarks. That's useful because it forces specificity.
Ask these questions before you touch anything:
- Is the gap isolated or broad? If only mobile is weak, don't launch a full-site redesign.
- Is the gap persistent? One ugly week isn't enough.
- Does the gap line up with customer behavior? If add-to-cart is healthy and checkout completion is weak, stop rewriting landing copy and inspect checkout friction.
- Can you reproduce the issue? Broken flows, slow templates, and device-specific bugs usually reveal themselves when someone tests the journey.
A founder who can read gaps this way stops guessing. That alone saves a lot of wasted work.
#Estimate Revenue Impact and Prioritize Your Fixes
Insights are cheap. Prioritization is where money gets made.
Most brands already know they have problems. They don't know which one deserves the next sprint. If you can't connect a benchmark gap to likely revenue impact, it's just another item on a Slack list nobody finishes.

#Turn gaps into money decisions
You don't need a complicated finance model. You need a practical estimate.
Use this logic:
- Start with the benchmark gap you found.
- Pick the one funnel stage it affects.
- Estimate the extra orders or retained value if that stage improves.
- Compare that upside against the effort, time, and cost to implement.
Keep the estimate directional. Precision theater is useless here. What matters is whether one fix clearly dominates another.
A few examples:
| Gap | Likely action | Revenue lens |
|---|---|---|
| Mobile checkout completion is weak | Test checkout flow, payment options, shipping presentation | Protects demand already paid for |
| AOV trails peers | Improve bundles, upsells, merchandising order | Increases revenue without buying more traffic |
| Repeat purchase is soft | Fix post-purchase email and retention flows | Improves customer value and reduces CAC pressure |
| CAC is high | Tighten targeting, improve landing page alignment | Cuts waste before scaling spend |
If you're trying to evaluate whether automation or analysis work is worth the effort, a simple tool for evaluating AI strategy ROI can help frame the decision in cost-versus-output terms.
The best fix isn't the one with the loudest complaint. It's the one with the clearest path to more profitable revenue.
#Use one priority stack for the whole business
Founders must prioritize improvement efforts on metrics showing the largest negative variance across four categories: customer acquisition, conversion, retention, and financials, including examples such as CAC, click-through rates, add-to-cart rate, checkout completion, repeat purchase rate, CLV, AOV, gross margin, and inventory turnover, according to this overview of ecommerce benchmark data.
That four-part structure is practical because it prevents local optimization. A team that only chases conversion can miss a retention leak. A team that only cuts CAC can end up buying cheaper, worse customers.
Use this ranking method:
- Largest negative variance. Where are you furthest behind?
- Closest revenue path. Which fix can affect money fastest?
- Execution difficulty. Can your team implement it soon?
- Confidence level. Do you have enough evidence to act?
Then choose one primary fix and one secondary fix. Not ten.
Too many brands mistake motion for optimization. They pile on CRO tests, ad tweaks, pricing experiments, and lifecycle changes at the same time. Then they can't tell what worked. Good operators reduce the list until the next move is obvious.
#Make Benchmarking a Rhythm Not a One-Time Project
Founders turn benchmarking into a big annual chore, then avoid it because it feels heavy. That's backwards. This works better as a rhythm.
A simple cycle is enough:
#Run the same review every cycle
Use the same five moves each time.
- Define your handful of core metrics and keep the definitions fixed.
- Measure your current performance from Shopify, GA4, ad platforms, and your CRM.
- Compare it to your baseline and your peer set.
- Analyze the biggest gap until you find the likely cause.
- Act on the single fix with the strongest revenue case.
Block time for it on a recurring calendar invite. Weekly is fine for fast-moving brands. Monthly is fine for smaller teams. The point is consistency.
Consistency beats intensity. A short, disciplined review done repeatedly is more useful than an overbuilt quarterly teardown nobody wants to repeat.
#Do one thing today
If you want the fastest useful start, do this:
Make a one-page benchmark sheet with your current AOV, CAC, conversion rate, and CLV, then add your mobile conversion rate, add-to-cart rate, and checkout completion rate underneath. That one sheet will expose more truth than most dashboard stacks.
Benchmarking gets easier once you stop treating it like a reporting exercise. It's a decision system. Done right, it tells you what matters, what's noise, and what fix deserves your next hour.
If you want that discipline without living in dashboards, Arlo is built for exactly this job. It gives Shopify brands a concise weekly read on what changed, why it matters, and what to do next, with actions ranked by urgency and revenue impact so you can spend less time deciphering metrics and more time fixing what grows the business.