
Revenue Management Opportunities for DTC
By Arthur Falcone · Founder of Arlo
Most DTC revenue advice starts with “buy more traffic” and ends with a ROAS screenshot. That approach misses the expensive part of the business: the orders that never complete, the orders that get returned, and the customers whose second purchase never arrives after the discount has already reduced margin.
Revenue management is more useful when it measures what the store keeps, not just what the storefront records. A campaign can increase gross sales while creating low-retention customers, return-heavy orders, or contribution losses after fulfillment and incentives. The practical question is simple: where can the business recover profitable revenue from demand it already has?
#Table of Contents
- Redefining Revenue Management for Modern DTC
- Quantifying Checkout Friction and Unexpected Costs
- Connecting Device Gaps and Return Rates to Net Revenue
- Managing Retention as a Cohort and Margin Problem
- Prioritizing High-Impact Fixes Over Vanity Projects
- Building a Weekly Revenue Review Ritual
#Redefining Revenue Management for Modern DTC
Founder-led brands often treat revenue management as an acquisition problem. The weekly conversation centers on spend, sessions, first-order ROAS, and whether a campaign produced enough purchases to keep running. Those metrics matter, but they don't tell you whether the revenue is durable or profitable.
The U.S. market is large enough that small operational improvements deserve serious attention. The U.S. Census Bureau's fourth-quarter 2025 e-commerce estimate puts online retail sales at $316.1 billion, representing 16.6% of total U.S. retail sales in that quarter. In a market of that scale, a modest improvement in conversion, retention, average order value, merchandising, or paid-media efficiency can affect a substantial revenue base.
The mistake is assuming that every gross sales increase is a good outcome. A heavily discounted first order may look attractive in an advertising dashboard while producing a customer who doesn't reorder. A product may convert strongly on mobile while generating costly returns because the product page creates an expectation gap. A retention flow may receive credit for an order the customer was already likely to place.
#Replace the top-line scoreboard
A more useful revenue view connects four layers:
- Gross sales: What the store records before refunds, returns, discounts, fulfillment costs, and acquisition expenses.
- Realized revenue: What remains after refunds and returns are accounted for.
- Contribution margin: What remains after variable costs such as product cost, fulfillment, payment fees, discounts, returns, and marketing costs.
- Cohort contribution: How profitable a customer remains as time passes and repeat orders, support costs, and incentives accumulate.
This changes the question from “Which channel produced the most revenue?” to “Which channel produced customers and orders that the business can keep profitably?”
Practical rule: Don't scale a channel because it produces cheap first orders until you know how those customers behave after the first purchase.
Platform ROAS can also overstate performance by assigning credit to ads that influenced a purchase without proving that the ad created an incremental order. Teams that want a more reliable view should learn how to measure true ROAS without platform bias, then compare channel results with contribution margin and customer cohorts.
The best revenue management opportunities often sit below the acquisition layer. They include fixing checkout errors, revealing delivery costs earlier, improving the mobile buying path, reducing avoidable returns, and identifying the cohort whose repeat economics deteriorate. A broader e-commerce growth strategy should therefore include post-click leakage, not just a larger media budget.
#Quantifying Checkout Friction and Unexpected Costs
Checkout abandonment isn't one problem. It's a collection of failures that happen at different moments, on different devices, and for different reasons. Treating every abandoned cart as equally recoverable leads to wasted engineering time and aggressive remarketing toward shoppers who were only browsing.
Baymard research reports that approximately 70% of online shopping carts are abandoned after products are added. In the cited U.S. survey, 39% of shoppers abandoned checkout because extra costs such as shipping, taxes, or fees were too high, while 14% left because they couldn't see or calculate the total order cost up front. Those findings make unexpected costs one of the clearest places to investigate first. Baymard's checkout evidence summarized by Statista supports a practical conclusion: price transparency belongs on the product and cart experience, not only on the payment screen.
#Find the exact point where demand disappears
Start with funnel-stage conversion, separated by mobile and desktop. Then segment the same funnel by:
- Traffic source: Compare paid social, paid search, email, organic search, affiliates, and direct traffic.
- Customer status: Separate new visitors from returning customers.
- Device: Look for a sharp decline when shoppers move from product page to cart, or from cart to checkout.
- Checkout step: Identify whether customers leave when shipping, taxes, payment methods, delivery estimates, or account creation appears.
- Geography and basket value: A shipping shock may affect one region or lower-value baskets far more than others.
Don't rely on the overall abandonment rate to tell you what to fix. A store can have healthy desktop checkout behavior and a serious mobile payment problem. Another can have strong product-page engagement but lose buyers when the final landed cost appears.
#Turn friction into a revenue estimate
Use a simple opportunity model:
Expected recovered revenue = affected checkout sessions × estimated reduction in abandonment × average contribution margin
The model should use contribution margin rather than gross order value. If a change encourages orders with expensive fulfillment, high refund rates, or weak product economics, the store may recover sales without recovering profit.
The following matrix keeps the diagnosis close to an operating action.
| Friction Point | Abandonment Driver | Operational Fix |
|---|---|---|
| Shipping, tax, or fee shock | The final cost is higher than the shopper expected | Show estimated landed cost on product and cart pages |
| Total cost appears too late | The shopper can't evaluate affordability before checkout | Add delivery, tax, and fee disclosures earlier |
| Account creation requirement | The customer doesn't want another account | Make guest checkout prominent |
| Long or complicated form | The customer loses patience or makes an error | Remove unnecessary fields and simplify the sequence |
| Payment failure or limited payment choice | The preferred payment method isn't available or works poorly | Test payment methods by device, geography, and browser |
| Technical errors | The customer can't complete the order | Monitor failed payments, validation errors, and crashes |
An A/B test should validate the highest-value fix, with guardrails for payment failures, refunds, fraudulent transactions, and contribution margin. Baymard's checkout benchmark reviewed more than 30,000 checkout elements across 344 leading U.S. and European sites, and its modeled conversion opportunity is a benchmark, not a guaranteed store-level result. The implementation team should trust the store's own funnel evidence first.
Payment costs belong in the same analysis. A checkout redesign that improves completion but routes more volume through an expensive payment path may produce less contribution profit than expected. Review the store's payment gateway fees alongside conversion data before declaring a checkout win.
#Connecting Device Gaps and Return Rates to Net Revenue
A high conversion rate can hide a weak business outcome. If a product sells well to mobile shoppers but those orders return frequently, the store may be optimizing the wrong endpoint. Gross merchandise value records the purchase. Net realized revenue records what survives the return, refund, fulfillment, and margin process.
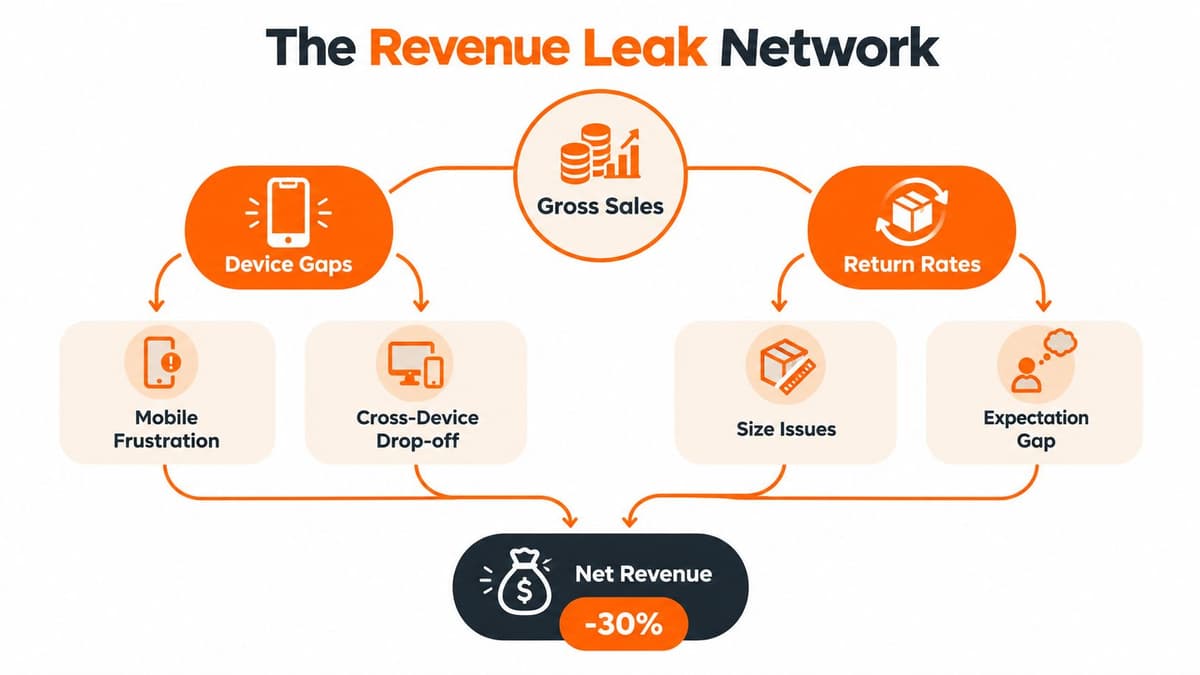
Online returns reached an estimated 19.3% of sales in 2025, compared with 15.8% across retail overall, while Shopify benchmarks place mobile conversion around 1.2% versus 1.9% on desktop. These figures come from Shopify's analysis of e-commerce returns. Together, they show why device performance and post-purchase leakage shouldn't live in separate reporting systems.
#Diagnose the interaction, not just each metric
A mobile conversion gap may come from slow rendering, difficult navigation, poor image presentation, weak sizing information, payment friction, or a mismatch between the ad creative and landing page. Return behavior may expose the same problem from a different angle. Customers who buy after seeing an incomplete or misleading mobile presentation may receive a product that doesn't match their expectation.
Review net revenue by product, channel, device, and customer cohort. For each combination, compare:
- Gross sales and order count
- Refund and return rate
- Product cost and fulfillment expense
- Discounts and acquisition cost
- Contribution margin after the order is resolved
- Repeat behavior after the first purchase
This analysis can change the answer to a traffic question. A high-return SKU shouldn't automatically receive more paid budget because it converts well. A product with weaker gross conversion may create more valuable revenue if customers keep it, require less support, and reorder.
#Make product fixes specific
Don't respond to a return problem with a generic “improve the returns policy” project. Identify the operational cause. A sizing issue may require clearer measurements, comparison guidance, or improved product photography. An expectation gap may require showing scale, material, fit, color, use context, or delivery timing more clearly.
Device-level fixes also need a narrow hypothesis. If shoppers drop after opening the cart, test cart usability. If they leave when payment loads, test the payment experience. If mobile sessions reach checkout but return at a higher rate, review the path from creative to product page and compare the information a mobile shopper sees.
The key revenue management opportunity is not just to increase mobile conversion or reduce returns in isolation. It's to increase the share of orders that become kept, paid, contribution-positive revenue. That requires one reporting view that follows the customer from first visit through post-purchase resolution.
#Managing Retention as a Cohort and Margin Problem
Retention programs become expensive when attributed revenue is treated as incremental revenue. An email may receive credit for an order from a customer who was already ready to buy. A broad discount can also reduce margin for customers who would have returned without an incentive.
Baymard research reports that 42% of U.S. shoppers abandon carts because they're merely browsing or not ready to buy. The Baymard checkout usability report shows why retention analysis needs the same discipline: an abandoned session does not automatically represent recoverable intent. After the first order, a customer who receives a win-back message may also have purchased without it.
#Build cohorts that explain behavior
Define cohorts by first-purchase month, acquisition channel, product, and subscription status. Calculate these measures for each cohort:
- Repeat-purchase rate.
- Time to second order.
- Average order value.
- Gross margin.
- Refund and return rate.
- Contribution margin after incentives and acquisition cost.
The goal is a usable view of cohort quality, not a more elaborate dashboard. Track which customers become more valuable, which cohorts lose margin over time, and when repeat probability falls sharply. Cohort margin decay can turn apparently healthy retention into unprofitable revenue.
A replenishment message should arrive before the historical reorder window. Sending it after disengagement limits the opportunity. An education sequence may fit a product that requires setup or repeated use. A win-back offer may work for a profitable cohort while damaging a segment with weak contribution margin.
#Measure the lift you created
Use randomized holdouts. Compare customers who receive the retention treatment with a control group that does not, then report:
- Incremental orders
- Incremental revenue
- Contribution profit after the incentive
- Confidence intervals
- Unsubscribe rate
- Refund and return behavior
This avoids assigning every later purchase to an email flow. The relevant opportunity model is:
Eligible customers × expected incremental conversion lift × contribution profit per order
The output should be a ranked action, such as targeting customers past the historical reorder window who have no second purchase. “Send more campaigns” is not an operating plan.
A message earns credit only when it produces profitable orders that would not have happened otherwise.
Review retention at the cohort level before expanding any program. A subscription can increase purchase frequency while creating churn, support work, fulfillment complexity, or discount pressure. A first-order incentive can acquire a durable customer, or attract a segment that buys only at a reduced price. The decision belongs in the margin review, where incremental orders are weighed against the profit and operational cost they create.
#Prioritizing High-Impact Fixes Over Vanity Projects
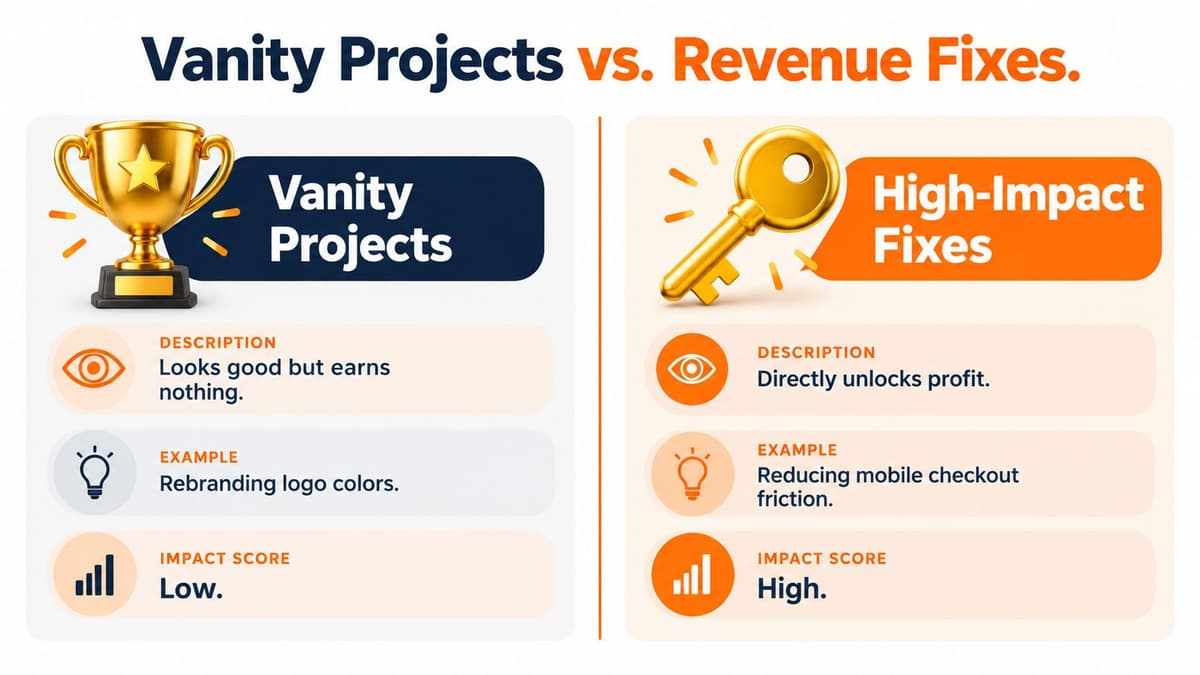
A founder with limited engineering and marketing capacity can't improve every part of the store at once. The practical choice is usually between a visible project, such as refreshing brand colors or launching a referral program, and a less glamorous fix, such as repairing mobile checkout errors or clarifying shipping costs.
The second option often deserves priority because it addresses an existing leak. A referral program may create future demand. A broken checkout prevents current demand from becoming an order.
#Use a decision matrix
Rank each proposed initiative against four questions:
| Decision Factor | Low-Priority Signal | High-Priority Signal |
|---|---|---|
| Recoverable dollars | The value is difficult to connect to a measured leak | The opportunity is tied to affected sessions, margin, or repeat customers |
| Implementation effort | Requires a broad rebrand or long platform project | Can be tested with a focused product, checkout, or lifecycle change |
| Time to impact | Results depend on future audience growth | Existing demand is already reaching the affected step |
| Risk to profit | Success is defined by clicks or gross sales | Success includes contribution margin and quality guardrails |
A mobile checkout problem may score high on recoverable dollars, low on implementation effort, and fast on time to impact. A referral program may be strategically useful, but it should wait if the store can't explain its current mobile drop-off or return economics.
Baymard estimates that the average large e-commerce site could increase conversion by 35.26% through checkout redesign, as described in its current checkout research. That figure is a modeled benchmark, not a promise for an individual store. Use it to justify investigation, not to forecast a guaranteed outcome. Validate the actual lift through a controlled test and measure what happens to margin and order quality.
#Say no with an explicit scoring rule
Give every idea a short written hypothesis:
“If we fix this observed leak for this customer or device segment, we expect more contribution-positive orders without worsening returns, refunds, or payment failures.”
If the team can't identify the affected segment, baseline metric, expected economic outcome, or test method, the project isn't ready. This doesn't mean the idea is bad. It means the business shouldn't spend scarce resources on it before higher-confidence revenue management opportunities are addressed.
#Building a Weekly Revenue Review Ritual
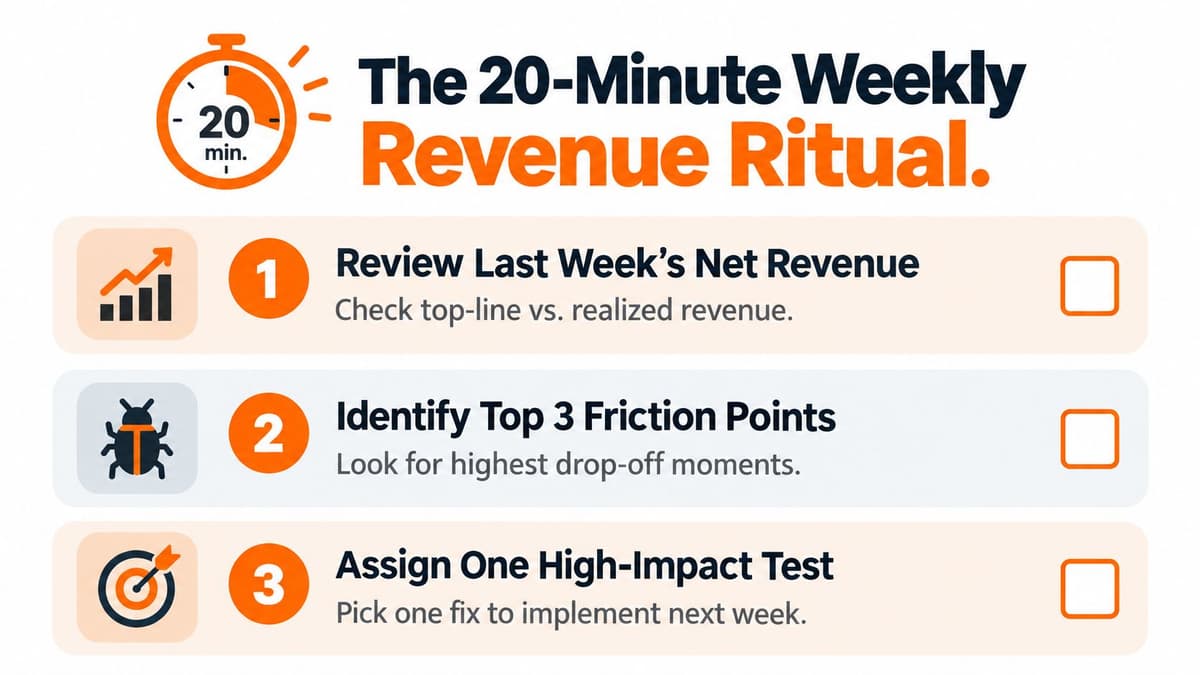
Revenue management only works when someone reviews the evidence consistently. A weekly ritual should be short enough to survive busy periods and structured enough to prevent a single bad sales day from triggering random changes.
#Start with realized performance
Review last week's gross sales, refunds, returns, discounts, fulfillment costs, acquisition spend, and contribution margin. Compare the result with the prior comparable period, but don't react to ordinary variance without checking the drivers. A sales decline caused by fewer sessions requires a different action from one caused by lower mobile conversion or a payment failure.
Then inspect the customer mix. Separate new and returning customers, identify which acquisition channels supplied them, and check whether recent cohorts are behaving differently from established ones.
Customer economics deserve a permanent place on this review. Acquiring a new customer costs 5 to 7 times more than encouraging a repeat purchase, according to Sendcloud's e-commerce coverage. That comparison shouldn't justify blanket discounting. It should prompt a weekly question about whether the next dollar is better spent acquiring a new customer or helping a profitable existing cohort return.
#Find the three largest leaks
Use the same diagnostic order each week:
- Revenue quality: Check realized revenue and contribution margin, not only gross sales.
- Funnel friction: Find the largest drop-off by device, source, and checkout step.
- Product and cohort behavior: Look for return-heavy products, weak repeat cohorts, and campaigns whose short-term results are deteriorating.
Don't create a long backlog from this review. Select the top three observed friction points, then assign one high-impact test for the coming week. Record the baseline, the target metric, the guardrails, the owner, and the date when the result will be reviewed.
A simple forecast should also reflect sessions, conversion rate, average order value, repeat purchases, refunds, and returns rather than extrapolating gross sales alone. Founders who need a broader planning framework can use these revenue forecasts for SMEs as a reference, then adapt the model to their own contribution economics.
Use a weekly growth review to keep decisions attached to evidence instead of dashboard noise.
The review should end with one decision: what will change, who owns it, and how the business will know whether it improved profitable revenue. A lightweight operating habit beats a large dashboard that nobody turns into action.
Arlo analyzes Shopify sales, traffic, customer, and product data to produce a weekly report that ranks revenue opportunities by urgency and dollar impact. Visit Arlo to turn checkout leaks, retention decay, acquisition waste, and device gaps into a focused action plan for your store.