
Triple Whale Alternative: The 2026 Comparison Guide
By Arthur Falcone · Founder of Arlo
Most founders don't need another attribution dashboard. They need to know which decision to make before the next campaign, inventory order, or weekly growth meeting. That's the uncomfortable truth behind the search for a Triple Whale alternative. A polished view of blended ROAS can still leave a team with no clear answer on what to fix, pause, test, or scale.
Triple Whale remains relevant because it combines ad-platform data, a tracking pixel, probabilistic or multi-touch attribution, and an AI assistant in one Shopify-focused interface. But its paid tiers are commonly reported to begin around $129 to $179 per month, then rise toward roughly $200 to $500 or more monthly based on order volume and plan scope, according to 2026 Triple Whale alternatives pricing coverage. That price can be reasonable when you need the entire stack. It's wasteful when your real issue is broken tracking, weak retention visibility, or an inability to turn reports into weekly action.
The right replacement depends on the problem underneath the dashboard. Some brands need a cleaner data pipeline. Others need incrementality testing, profit reporting, customer lifetime value analysis, or a plain-language operating rhythm. The comparison below treats those as different buying decisions, because they are.
#Table of Contents
- Why Most Founders Search for a Triple Whale Alternative
- The 2026 Alternative Market Breakdown
- Side-by-Side Comparison of Top Alternatives
- How to Diagnose Your Actual Analytics Problem
- Real-World Scenarios and Best-Fit Recommendations
- Migration Checklist and First 30 Days Plan
- Prioritized Action Items and ROI Examples
#Why Most Founders Search for a Triple Whale Alternative
The popular advice is simple: if you're unhappy with Triple Whale, choose another attribution platform. I disagree. Attribution is often the wrong first purchase.
Triple Whale began in 2021 as an eCommerce dashboard for founders. By 2026, it was commonly positioned as a Shopify-native platform that joins ad data, pixel tracking, attribution, and AI analysis. That broad scope explains both its appeal and the alternative market around it. Many competitors don't replace the whole product. They replace one job that Triple Whale performs.
#Cost can be the first warning
A growing store may outgrow a lower plan before it develops the team or measurement discipline needed to use a more advanced stack. Paying for deeper attribution won't help if nobody reviews the output consistently or if the business still lacks reliable contribution-margin data.
Independent 2026 comparisons describe alternatives ranging from entry tools around $30 to $59 per month, through mid-market products around $200 to $500 per month, to enterprise options near $1,500 per month. Those bands reflect different products, not merely different vendors. Market analysis of Shopify analytics alternatives separates the category into attribution, profit tracking, and broader business intelligence for exactly this reason.
#Attribution skepticism is rational
Post-privacy tracking makes platform numbers directional rather than perfectly reconcilable. Shopify, Meta, Google, and an attribution tool can all assign credit differently without one system being obviously “broken.” If your team debates which dashboard is right every week, buying a more complex model may intensify the argument instead of resolving it.
#Founders need decisions, not charts
A founder-led store often asks practical questions:
- What changed this week?
- Which product or channel caused it?
- What deserves attention first?
- What action has the clearest revenue upside?
If your team has data but no ranked plan, an interpretation-first layer may create more value than another console. Research on the category highlights this gap, noting that many comparisons focus on attribution while underexplaining when a simpler recommendation layer is more useful for smaller teams. The 2026 comparison of Triple Whale alternatives by use case makes the distinction between measurement depth and operational actionability especially clear.
Practical rule: Don't replace Triple Whale until you can state the exact decision your current stack fails to support.
#The 2026 Alternative Market Breakdown
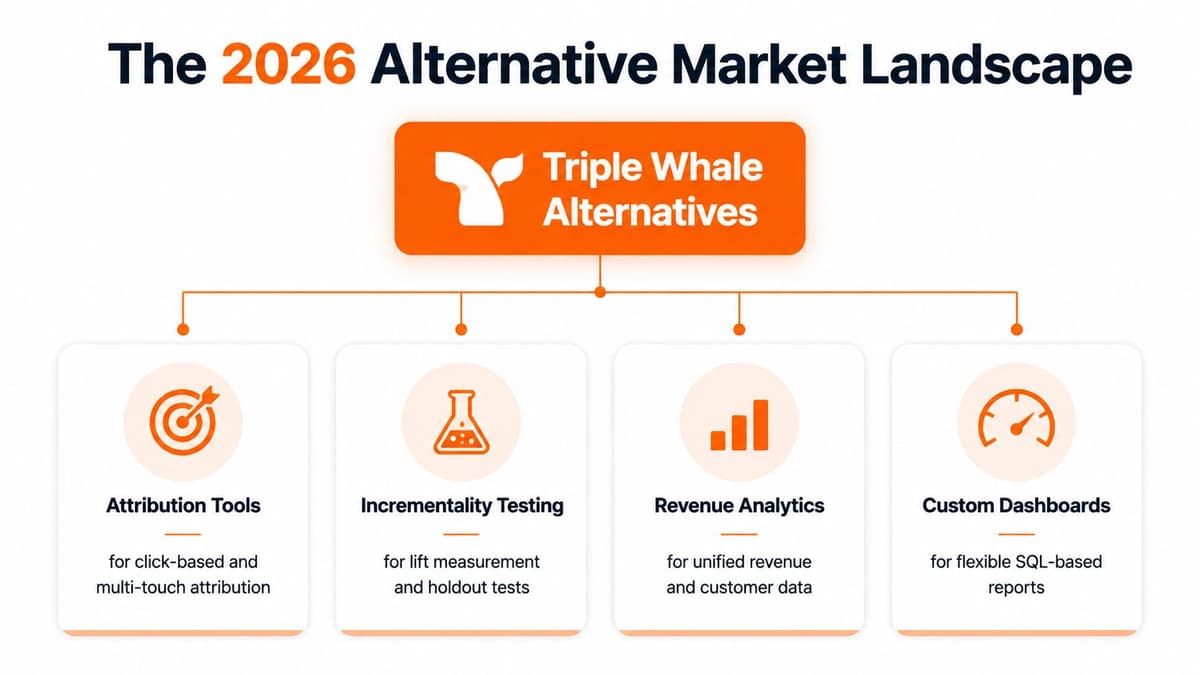
The alternative market has split into four practical jobs. Treating every tool as a direct Triple Whale substitute produces bad evaluations because a server-side tracking product, an attribution suite, and an analyst-style reporting layer don't solve the same problem. Founders should choose the business problem first, then compare vendors within that category.
#Attribution and incrementality
Northbeam and SegmentStream serve teams that need advanced measurement. They fit when channel allocation affects major financial decisions and click-path reporting is no longer enough. SegmentStream is positioned for brands spending $100K or more per month, combining multi-model attribution, geo-holdout incrementality testing, and automated weekly budget optimization. Pricing is custom and designed for that level of ad spend, as outlined in SegmentStream's comparison of Triple Whale alternatives.
Attribution and incrementality answer different questions. Attribution assigns credit to marketing touchpoints. Incrementality tests whether marketing caused additional outcomes that would not have occurred otherwise. That distinction matters when retargeting or branded search looks efficient but mainly captures demand that already existed.
#Profit tracking and revenue analytics
Lifetimely and Polar Analytics fit merchants focused on profit, cohorts, customer value, and unified revenue reporting. They can create more operating value than attribution software when the core question is whether a customer segment, product line, or repeat-purchase pattern produces healthy economics.
Broader BI products blend data from multiple sources and support custom reporting. They also demand more implementation work and analytical skill. An ecommerce analytics platform focused on interpretation belongs in a separate buying category because it turns Shopify and marketing signals into a concise operating plan instead of adding another warehouse-style reporting environment.
| Category | Core problem solved | Typical fit |
|---|---|---|
| Attribution | Assigning credit across marketing touchpoints | Paid-media teams comparing channels |
| Incrementality | Measuring causal lift and holdout performance | Larger advertisers reallocating budgets |
| Profit tracking | Connecting sales, costs, cohorts, and customer value | Operators managing contribution and retention |
| Interpretation | Turning scattered metrics into weekly priorities | Founder-led teams without a dedicated analyst |
Pricing follows the same split. Entry tools tend toward lower monthly costs, mid-market attribution and analytics products sit higher, and enterprise measurement or BI suites can approach $1,500 per month, based on the cited 2026 market comparison. Pick the job your team needs done before evaluating a vendor.
#Side-by-Side Comparison of Top Alternatives
A useful comparison should show how each tool changes your operating rhythm. Starting price matters, but decision cadence matters more. A dashboard that requires an analyst to interpret every finding may be less practical for a founder who needs a weekly plan by Monday morning.
| Tool | Starting Price | Best For | Attribution Type | Decision Cadence |
|---|---|---|---|---|
| Triple Whale | Commonly around $129 to $179 per month for paid tiers | Shopify-native DTC teams needing a unified stack | Pixel-based, probabilistic or multi-touch | Daily monitoring and weekly review |
| SegmentStream | Custom pricing, oriented toward $100K+ monthly ad spend | Brands needing incrementality and budget optimization | Multi-model attribution plus geo-holdout testing | Weekly budget decisions |
| Northbeam | Custom pricing | Larger paid-media teams needing deeper measurement | Multi-touch attribution and media-mix modeling | Weekly and monthly allocation |
| Polar Analytics | Lower-cost Shopify analytics option | Brands prioritizing revenue and profit visibility | Shopify and ad-platform reporting | Weekly operating review |
| Lifetimely | Lower-cost LTV-focused option | Subscription and repeat-purchase brands | Customer and cohort analysis, not broad attribution | Cohort and retention review |
| Elevar or TrackBee | Varies by implementation | Stores with incomplete conversion capture | Server-side tracking and signal recovery | Continuous data-quality monitoring |
| Arlo | Simple interpretation-first model | Founder-led stores needing ranked actions | Shopify and marketing signal interpretation | Weekly action plan |
Prices vary by order volume, data sources, and implementation. The most defensible distinction is fit. Northbeam and SegmentStream are measurement investments. Lifetimely is a customer-value investment. Elevar and TrackBee address the pipeline. Arlo addresses the gap between seeing a metric and knowing what to do next.
For complex vendor selection, use the same discipline you'd apply to any operational partner. A side-by-side staffing agency comparison is a useful example of evaluating providers by practical fit instead of relying on brand familiarity alone. Ask every analytics vendor how the product handles missing data, conflicting totals, attribution windows, ownership of historical data, and the weekly decisions your team makes.
If your team wants a deeper explanation of attribution software itself, this guide to attribution marketing software provides useful context. Don't let feature count decide the purchase. Decide whether you need a more credible measurement model, more complete inputs, or better interpretation.
#How to Diagnose Your Actual Analytics Problem
Start with the symptom, not the tool. Most wasted analytics spend begins when a founder buys attribution software to solve a tracking problem or buys a dashboard to solve an accountability problem.
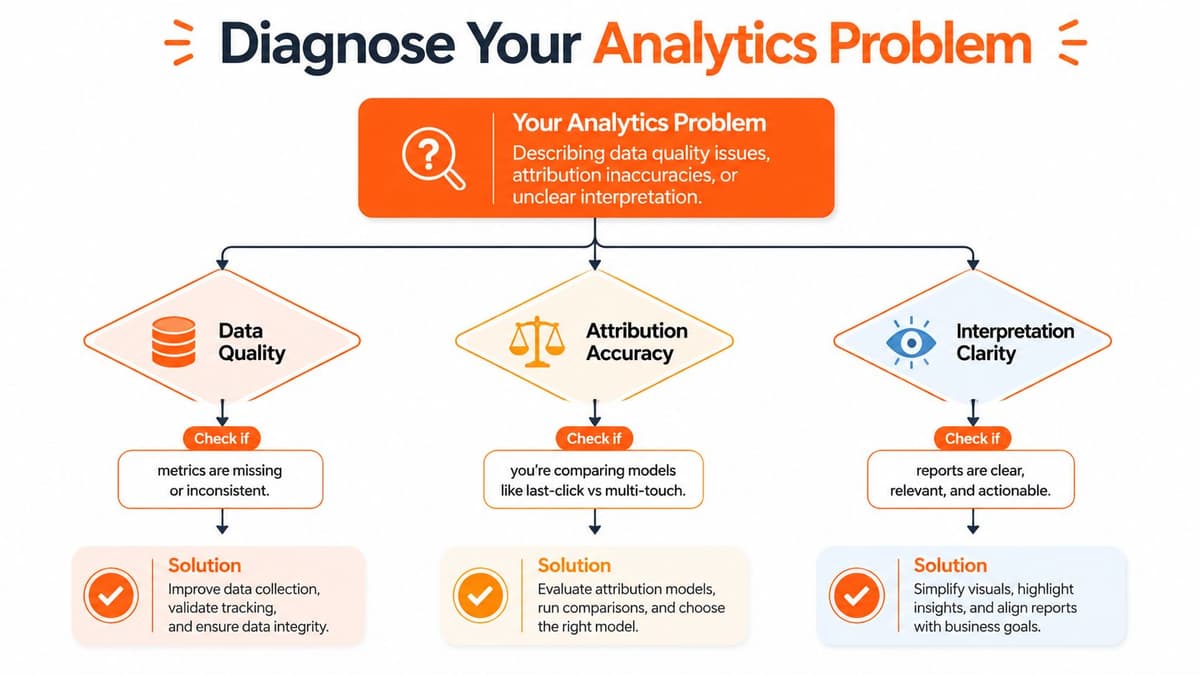
#Question one, are the numbers incomplete
Compare order counts, revenue, UTMs, purchase events, and ad-platform conversions across the systems you already use. If events disappear, orders are duplicated, or campaign names are inconsistent, fix the pipeline first. Elevar and TrackBee are relevant when the merchant needs stronger server-side capture and signal recovery rather than a new interpretation layer.
A new dashboard can only organize the data it receives. It can't reconstruct a missing purchase event with confidence.
#Question two, is the data clean but the credit disputed
If Shopify totals and conversion capture are stable, but your team distrusts ROAS or channel credit, evaluate methodology. Compare last-click, platform-reported, multi-touch, and incrementality views. Northbeam or SegmentStream may fit a brand that needs deeper budget allocation analysis. A smaller store may be better served by a simpler reporting stack and a documented rule for how decisions get made.
#Question three, do you have data without action
This is the most common founder-led gap. The team can see sales, traffic, products, and campaigns, but nobody produces a ranked list of actions with an owner and a deadline. In that case, another attribution console adds reading, not necessarily progress.
Use a weekly scorecard with three fields: what changed, why it changed, and what happens next. The Skup ecommerce analytics playbook offers useful guidance on organizing ecommerce metrics around business decisions instead of collecting metrics without a clear use.
Diagnostic shortcut: If you can't identify the next action after reviewing your dashboard, your problem is interpretation clarity.
#Real-World Scenarios and Best-Fit Recommendations
A tool earns its place when it improves a decision, not when it fills another browser tab.

#The paid-media brand testing causality
A brand spending $50K per month on paid media may need to know whether incremental demand justifies an allocation change. If the team already has reliable conversion capture, SegmentStream is the stronger alternative because its described fit includes multi-model attribution, geo-holdout testing, and automated weekly budget optimization. Triple Whale may still be adequate for consolidated monitoring, but it won't be the first choice when causal lift is the core decision.
#The founder-led store needing a weekly plan
A store generating revenue in the $1M to $5M range may have enough activity to create reporting complexity but not enough staff to hire a dedicated analyst. This business doesn't necessarily need enterprise attribution. It needs a concise explanation of revenue movement, product performance, customer behavior, traffic changes, and the next actions ranked by impact.
An interpretation-first platform such as Arlo can fit this operating model. It reads Shopify, traffic, customer, and product signals and produces a weekly report that explains what changed, why it matters, and what to do next. That's a different purchase from Northbeam or Rockerbox. You're buying decision support, not attribution purity.
The next step is to turn that report into a fixed meeting ritual. Assign an owner to each action, record the expected outcome, and review completion the following week.
The video below offers another way to think about the role of analytics in operational decision-making.
#The subscription brand optimizing retention
A subscription or repeat-purchase business shouldn't lead with paid-media attribution if the bigger opportunity sits in customer value. Lifetimely or Polar Analytics is a more direct fit when the team needs cohort visibility, repeat-purchase analysis, product economics, and retention context. The central question becomes which customers return and what behaviors separate durable value from one-time revenue.
#The high-volume store with broken signals
A high-volume store with inconsistent conversion events should delay attribution migration. First, audit the purchase event, consent behavior, server-side capture, UTMs, checkout transitions, and ad-platform signal quality. A pipeline solution such as Elevar or TrackBee may solve the immediate business problem more effectively than switching from one dashboard to another.
#Migration Checklist and First 30 Days Plan
Treat migration as a measurement project. Begin by documenting the existing stack before installing anything. The goal is decision continuity while you test whether the replacement produces outputs the team can trust and use.
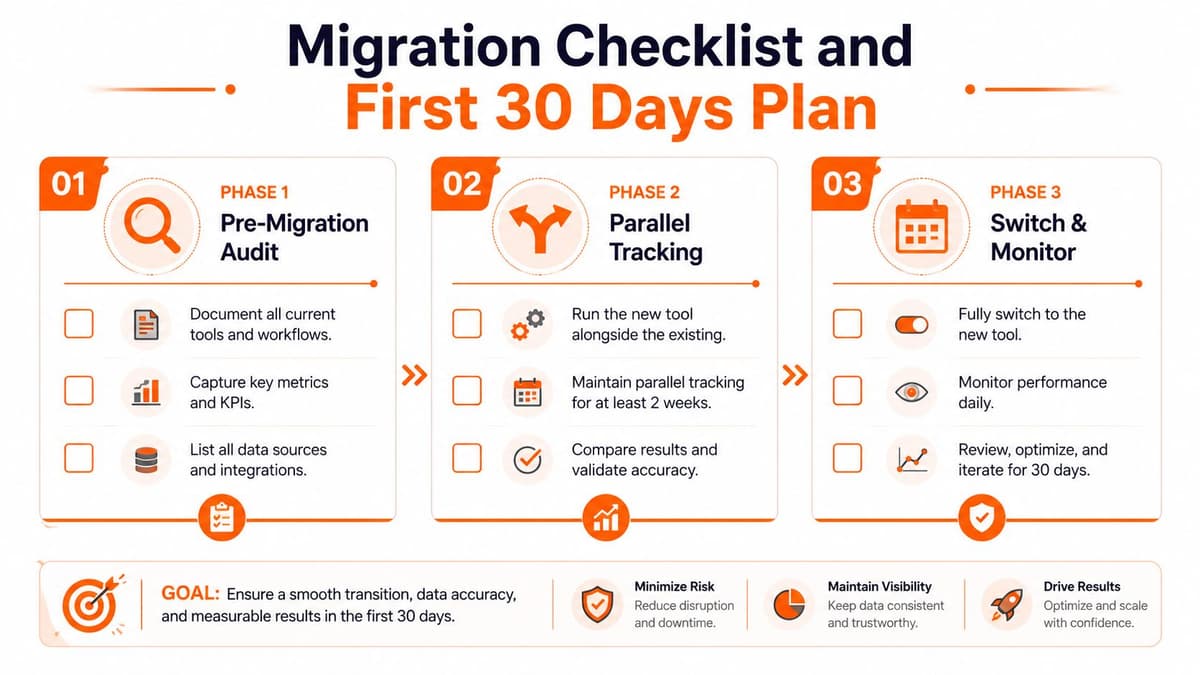
#Phase one, document the current stack
Record the reports, decisions, sources, and conflicts already in play:
- Active reports: Identify the Triple Whale views the team uses.
- Decision inputs: Connect each metric to budget, merchandising, retention, or site decisions.
- Data sources: List Shopify, ad platforms, email, subscription, fulfillment, and cost inputs.
- Known conflicts: Note mismatched totals and the system used as the operational reference.
If a report has never changed a decision, do not rebuild it automatically. Remove dashboards that add noise, then define the small set of views required for weekly action planning.
#Phase two, run parallel tracking
Run the new product alongside the existing stack for at least two weeks, as shown in the migration plan. Compare purchase counts, revenue, campaign naming, product totals, customer cohorts, and update timing. Identical attribution totals are not the standard. Require a clear explanation for differences and consistent directional usefulness.
Tell the team: “We're running both systems during validation. No budget decision will rely on an unexplained metric. Log discrepancies, their likely cause, and the owner responsible for resolution.”
Use this data analytics dashboard guide to decide which views belong in the new operating layer and which should be retired.
#Phase three, switch and monitor
For the first 30 days after switching, review core data daily and hold one structured weekly review. Check missing orders, broken integrations, delayed events, unexplained revenue changes, and reports nobody can interpret.
The migration is failing when reconciliation takes more time than action, metric owners cannot explain definitions, or budget decisions wait because the new output lacks credibility. A pipeline solution such as Elevar or TrackBee may address the immediate business problem more effectively, making a dashboard switch secondary.
#Prioritized Action Items and ROI Examples
A replacement tool cannot rescue a weak decision cadence. Start with the customer journey and retention mechanics that produce clear weekly actions, then use analytics to rank the next move.
#First, audit mobile checkout friction
Mobile checkout often deserves attention before a more advanced attribution model. One 2026 benchmark reports desktop conversion at 3.5% to 4.0% compared with mobile at 1.8% to 2.5%. Another Shopify-focused benchmark reports mobile conversion around 1.2% versus desktop at 1.9%, as documented in ecommerce conversion optimization benchmarks.
Review the mobile product page, cart, payment step, page speed, sticky add-to-cart behavior, shipping clarity, and error states. Track product views, add-to-cart rate, checkout initiation, payment completion, and revenue per session by device. Fix the largest step-level drop first.
#Second, repair automated email flows
A balanced DTC email program is expected to generate 10% to 15% of total revenue from automated flows and another 10% to 15% from campaigns, implying a combined contribution of roughly 20% to 30% when the program is healthy, according to email revenue contribution guidance.
Audit welcome, abandoned-cart, browse-abandonment, post-purchase, replenishment, and win-back flows. Track revenue per recipient, conversion rate, unsubscribe rate, and flow coverage. A missing or weak automation should be repaired before acquisition budget is reallocated.
#Third, create a weekly 20-minute review
Review five inputs every week: revenue, traffic, conversion, customer behavior, and product performance. Finish with three decisions, each assigned to an owner and due date. The marketing ROI meaning for 2026 reinforces the operating standard: connect spend to business outcomes rather than stopping at a dashboard metric.
Founder-led teams need plain-language priorities they can act on. Arlo offers a Shopify-based AI marketing analyst that turns store, traffic, customer, and product data into a concise weekly report with ranked actions and revenue context. Visit Arlo if your team needs that interpretation layer.