
Year Over Year Growth for DTC Founders, Explained
By Arthur Falcone · Founder of Arlo
Most advice about year over year growth starts with the formula and ends with a celebration. That's backwards. A big percentage can hide weaker customers, thinner margins, inflated prices, a promotional spike, or a business that's recovering from an awful comparison period.
I've looked at enough Shopify dashboards to know the headline number is rarely the diagnosis. YoY is useful, but only when you treat it as a starting question: what changed, which growth lever moved, and can the business repeat it?
#Table of Contents
- Why a Big YoY Number Can Still Be a Bad Sign
- The YoY Formula in One Sentence, Plus a Quick Example
- Worked YoY Examples for a Real Shopify Store
- When YoY Works and When You Need Something Else
- Five Ways YoY Growth Lies to You
- Realistic Ecommerce Growth Benchmarks for 2026
- What to Do When YoY Is Up and When It Is Down
- Turning YoY Into a Weekly Habit, Not a Yearly Report
#Why a Big YoY Number Can Still Be a Bad Sign
A founder sees a 312% YoY jump on a Shopify dashboard and finally exhales. The board deck gets updated, the team gets congratulated, and the next forecast assumes the same curve will continue.
Then the founder checks returning customers.
The store acquired a rush of first-time buyers through a viral moment. Paid traffic became more expensive. Customer support volume rose. Refunds increased. The business grew, but the quality of that growth deteriorated. A single annual percentage compressed all of those changes into one flattering number.
That's the central problem. YoY growth is mathematically precise but strategically incomplete. It can combine base effects, product mix shifts, timing differences, and one-off windfalls into a metric that looks authoritative while hiding the cause. A useful sales trend analysis framework should force you to inspect those causes rather than admire the percentage.
#The skincare spike nobody wants to explain
Consider a small skincare DTC brand that caught a TikTok moment. Its hero serum spread quickly, orders surged, and the team doubled its SKU count to capture demand. Revenue looked heroic against the previous year.
But the new customers behaved differently from the original audience. They bought once, used discount codes, and didn't return at the same rate. The wider catalog also diluted merchandising attention. The brand had more products, more orders, and a weaker customer lifetime value profile.
YoY still looked excellent because the prior comparison period was small and the viral event created an unusually strong current period. The percentage measured expansion in sales, not the health of the customer engine.
Founder rule: Never approve a growth story from revenue alone. Require traffic, conversion rate, average order value, new customers, returning customers, retention, discounts, and returns beside it.
The same issue appears in a mature store after a large wholesale order, a celebrity mention, or a short-lived promotional campaign. The business may have grown, but the repeatable operating system may not have improved.
That's why percentage growth without context is a vanity signal. Use YoY to identify where to investigate, then separate durable demand from an attractive comparison.
#The YoY Formula in One Sentence, Plus a Quick Example
YoY is simple math, but a careless comparison can still produce a useless answer. Year over year growth equals (current period value ÷ prior period value) - 1, expressed as a percentage. In plain English, subtract last year's matching figure from this year's, divide by last year's figure, and convert the result to a percentage, as explained in Investopedia's definition of year-over-year growth.
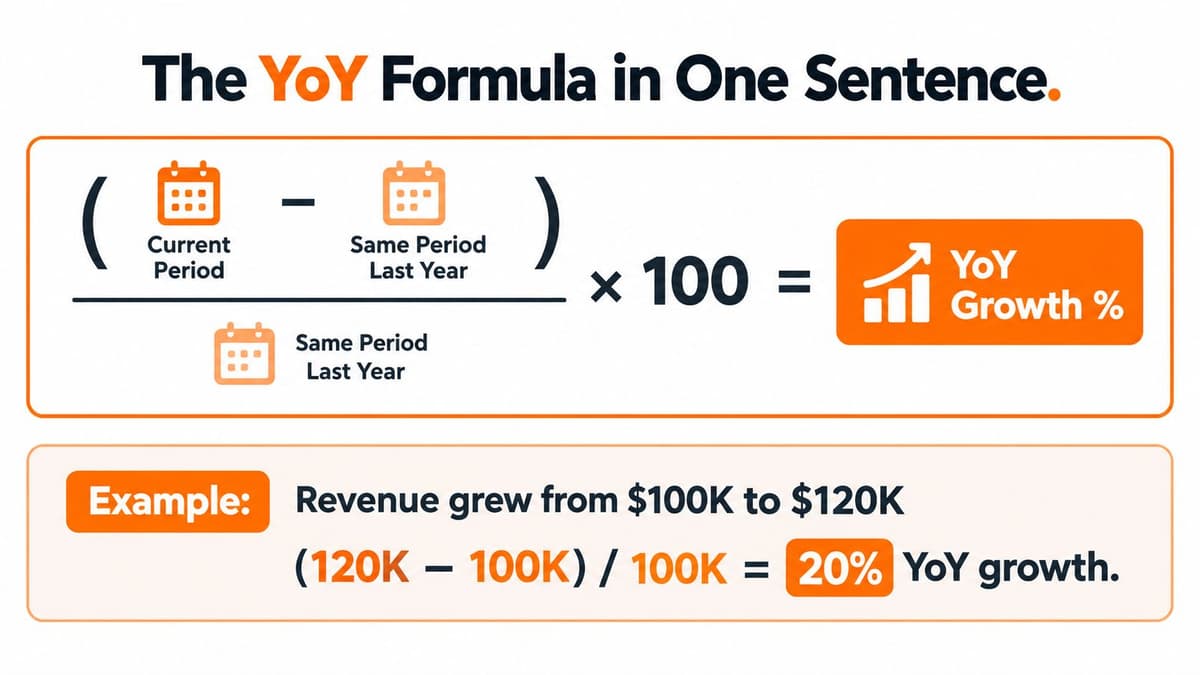
Take a simple Q4 revenue comparison:
- This Q4 revenue: $480,000
- Last Q4 revenue: $320,000
- Difference: $160,000
- Division: $160,000 ÷ $320,000 = 0.5
- YoY result: 50%
The matching-period rule matters. Compare Q4 with the previous Q4, not Q4 with Q3. Compare January with the previous January, not January with December. Comparable periods limit distortion from holidays, trading days, and seasonal buying patterns.
Use the same method for any metric with a usable year-ago comparison:
- Revenue
- Orders
- Average order value
- Sessions
- Conversion rate
- New customers
- Returning customers
For customer economics, pair the result with this guide from Alpha Omega Digital, a Melbourne agency on customer LTV. LTV adds a customer-quality layer that the basic formula cannot provide.
The formula is honest. The inputs often aren't. Tracking definitions may have changed, returns may be excluded in one period, a channel may have been added, or the prior-year base may have been abnormal. Confirm that the periods and metric definitions match before calculating.
#Worked YoY Examples for a Real Shopify Store
Use a fictional apparel store called Northline Apparel. Its dashboard contains enough detail to show why revenue alone can mislead. The table below uses realistic working figures for demonstration, not a reported company result.
| Metric | Last Year | This Year | Calculation | YoY Result |
|---|---|---|---|---|
| Revenue | $500,000 | $690,000 | ($690,000 - $500,000) ÷ $500,000 × 100 | 38% |
| Orders | 10,000 | 12,000 | (12,000 - 10,000) ÷ 10,000 × 100 | 20% |
| Average order value | $50 | $57.50 | ($57.50 - $50) ÷ $50 × 100 | 15% |
| New customers | 8,000 | 7,040 | (7,040 - 8,000) ÷ 8,000 × 100 | -12% |
#Revenue grew, but the acquisition pipeline contracted
Northline's revenue calculation is straightforward:
($690,000 - $500,000) ÷ $500,000 × 100 = 38% YoY growth.
That looks strong. Orders rose too:
(12,000 - 10,000) ÷ 10,000 × 100 = 20% YoY growth.
The store sold more often, but not all of the revenue came from acquiring more people. AOV increased from $50 to $57.50, producing:
($57.50 - $50) ÷ $50 × 100 = 15% YoY growth.
That could reflect bundles, higher prices, a stronger product mix, or more multi-item purchases. It's good only if margin and customer satisfaction held up.
The uncomfortable number is new customers:
(7,040 - 8,000) ÷ 8,000 × 100 = -12% YoY growth.
Northline generated more revenue while adding fewer new customers. Existing customers, higher basket size, or both carried the top line. That may be an efficient retention story, or it may signal that acquisition is becoming harder and the store is consuming its customer base.
A growth rate calculation guide can help standardize the arithmetic, but the operator still has to interpret the movement.
#One dashboard number cannot carry the verdict
Each metric answers a different question:
- Revenue: Did the business collect more sales?
- Orders: Did customers place more transactions?
- AOV: Did each transaction become more valuable?
- New customers: Is the future pipeline expanding?
Northline's verdict is mixed. The store grew its top line and transaction count, but new-customer acquisition weakened. The next review should inspect customer acquisition cost, conversion rate, repeat purchase behavior, gross margin, and return rates before approving a larger growth budget.
#When YoY Works and When You Need Something Else
YoY is a good lens when the business has a stable history and seasonality matters. It's a poor lens when the comparison period is too short, too unusual, or no longer represents the same business.
| Metric | Time Window | Best Used For | Main Weakness |
|---|---|---|---|
| YoY | Same period versus previous year | Annual planning and seasonal comparisons | Hides recent turning points |
| MoM | Current month versus previous month | Fast operational feedback | Strongly affected by seasonality |
| QoQ | Current quarter versus previous quarter | Medium-term planning | Can miss monthly volatility |
| Sequential | Adjacent comparable periods | Detecting momentum changes | Requires careful period matching |
#Three situations where YoY earns its place
Use YoY for annual board updates because investors and operators need a consistent view of progress against the prior year. It also works for seasonal category reviews. A holiday-heavy store should compare holiday performance with the equivalent holiday window, not with an adjacent low-demand month.
YoY is also useful when a strong holiday period distorts short-term comparisons. A founder can compare the same seasonal window, then use MoM or sequential data to understand what happened immediately afterward.
At the macro level, the framework is standard. U.S. real GDP reached $30.8 trillion in 2025, and real GDP increased by 2.2%, matching the average annual rate from 2000 to 2024, according to USAFacts' economy report. The same source reports U.S. year-over-year CPI inflation of 2.4% in January 2026, while average monthly inflation was 2.6% in 2025, down from 2.9% in 2024. The point for a Shopify founder is simple. YoY is a common statistical lens, not proof that your store improved operationally.
#Three situations where YoY actively misleads
A store younger than twelve months may not have a meaningful year-ago comparison. A launch year can also make the prior period nearly zero, producing an impressive percentage that says little about scale. Post-acquisition reporting creates another problem when the current business includes products, customers, or channels that didn't exist in the comparison year.
If you need a signal within ninety days, use MoM or QoQ. If you're grading the business against itself or presenting to investors, use YoY.
My decision rule is blunt: use YoY for comparability, sequential data for steering, and absolute dollars for consequences. Never let one replace the others.
#Five Ways YoY Growth Lies to You
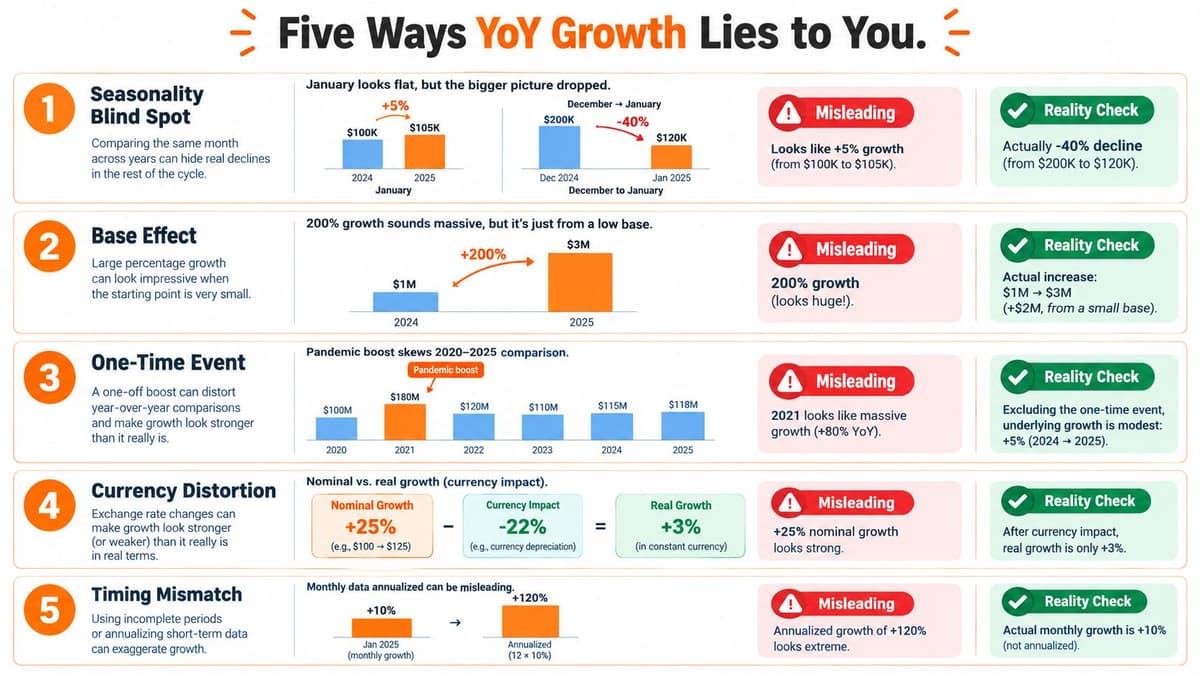
The arithmetic doesn't lie. Your interpretation can. These five traps routinely turn a clean Shopify percentage into a poor business decision.
#Base effect
A store that moves from $1 million to $3 million has 200% YoY growth, but that percentage doesn't mean the store has become a scaled enterprise. The absolute increase is $2 million, and the next comparison will be much harder because the base is now larger.
The base-effect research explains why an unusually high or low reference period can make YoY look artificially weak or strong. Correct the read by showing the absolute dollar change, the previous period's conditions, and a rolling average.
#Inflation
Nominal revenue can rise while unit demand falls. U.S. Census guidance notes that quarterly e-commerce sales figures aren't adjusted for price changes in the reported figures, as described in its e-commerce sales data.
For example, a store can report higher sales after raising prices while selling fewer units. The corrected read is not “demand grew.” It is “reported revenue grew, while unit volume needs separate verification.” Check units, price per unit, discount rate, and contribution margin.
#Mix shift
A bundle or wholesale channel can push AOV higher without increasing customer count. Suppose a store's AOV rises because more buyers select a large bundle, while new customers remain flat. Revenue may improve, but the acquisition engine hasn't necessarily strengthened.
Break revenue into traffic, conversion, AOV, and repeat purchase frequency. Shopify's ecommerce revenue growth framework uses those controllable levers to diagnose why revenue changed.
#Currency translation
A U.S. Shopify store selling abroad can report higher revenue when exchange rates translate overseas sales into more dollars. That reported growth may not represent more local-currency demand or more units sold.
Show reported revenue beside constant-currency revenue, local orders, and units. If only the translated dollar figure rose, call it currency-driven growth rather than customer-driven expansion.
#Calendar timing
A 53-week year or a shifted holiday window can place more high-value shopping days in one reporting period. The result may show a strong YoY figure even though customers merely bought earlier or later.
Ecommerce growth reporting illustrates why sequential context matters. U.S. quarterly growth moved from 10.1% YoY in Q1 2026 to 12.2% YoY in Q2 2026, while monthly July growth was 7.7% YoY, according to Practical Ecommerce's analysis. The corrected read is not to pick the strongest number. Compare the aligned periods, monthly progression, and absolute sales change.
#Realistic Ecommerce Growth Benchmarks for 2026
Don't build a DTC plan around media headlines. U.S. ecommerce sales reached about $1.234 trillion in 2025, up 5.4% YoY, while the first half of 2026 totaled $668.1 billion, up 11.1% YoY, according to Digital Commerce 360's U.S. ecommerce sales reporting. Those figures describe the market, not the growth rate every Shopify store should expect.
The same reporting notes that only 2002 and 2020 saw U.S. ecommerce sales growth of at least 30% YoY. That should reset founder expectations. Hypergrowth is an exception, usually tied to unusual market conditions, not a normal operating target.
The requested stage bands below are editorial planning ranges, not published benchmarks. Use them as a decision aid, then replace them with your category, channel, margin, and retention history.
| Stage | Annual Revenue Range | Realistic YoY Growth Band | Primary Constraint |
|---|---|---|---|
| Emerging store | Under $1 million | 20% to 50% | Product-market fit and acquisition efficiency |
| Scaling store | $1 million to $10 million | 15% to 30% | Paid acquisition saturation and operational capacity |
| Established brand | Above $10 million | 8% to 20% | Category maturity and retention ceiling |
#Emerging stores need proof, not just speed
A smaller store can grow quickly because it starts from a narrower base and still has obvious distribution opportunities. The constraint is usually not demand alone. It's whether the brand can acquire qualified customers without destroying margin or service quality.
#Scaling stores should protect economics
Between $1 million and $10 million, growth often becomes more expensive. Paid channels saturate, inventory commitments grow, and the founder has less room to fix mistakes manually. A lower growth rate with stronger contribution margin and repeat purchase quality can be the better outcome.
#Established brands need structural advantages
Above $10 million, category maturity makes easy gains less common. Beating the planning band by a wide margin usually points to a structural advantage such as a new product category, a stronger retention engine, a distribution partnership, or unusually efficient creative. Find that advantage before assuming luck will repeat.
Also separate nominal growth from real growth. Price changes, inflation, discounting, and channel mix can make revenue look healthier than unit demand. The Census e-commerce data is a useful reminder that reported sales aren't automatically a measure of real purchasing-power growth.
#What to Do When YoY Is Up and When It Is Down
A higher YoY figure is not a verdict. It is a prompt to inspect what improved. A lower figure is not a reason for immediate cuts. Find the driver, estimate its dollar impact, and act there first.
| Priority | When YoY Is Up | When YoY Is Down |
|---|---|---|
| 1 | Verify net sales after returns and discounts | Split the decline into traffic, conversion, AOV, and repeat rate |
| 2 | Secure inventory and protect ad capacity | Test for base-effect noise from a prior promotional peak |
| 3 | Raise AOV with bundles and upsells | Cut bottom-funnel waste before cutting LTV-positive channels |
| 4 | Reinvest part of incremental profit in retention | Survey recent and lapsed customers for the churn reason |
#If YoY is positive
-
Audit the quality of the growth. Reconcile gross sales with returns, refunds, discounts, cancellations, and contribution margin. A larger gross number can hide weaker net revenue or poorer economics.
-
Protect the demand already created. Reserve inventory for proven products and review ad budgets before the next demand window. Stockouts can reduce conversion, delay fulfillment, and weaken the following comparison period.
-
Increase AOV before buying more traffic. Add bundles, cart add-ons, post-purchase offers, and product recommendations to existing sessions. Improve the value of current demand before paying to create more of it.
-
Put part of incremental profit into retention. Use the investment for email flows, SMS, replenishment reminders, loyalty mechanics, and post-purchase education. Judge the result by repeat revenue and margin, not the size of the initial YoY headline.
Shopify's ecommerce growth guidance recommends reviewing revenue alongside conversion rate, AOV, repeat purchase or retention, CAC:LTV, contribution margin, and related customer metrics.
#If YoY is negative
Start with a driver tree. Split revenue into qualified traffic, conversion rate, AOV, and repeat purchase rate, then inspect sessions, CAC, cart abandonment, page speed, gross margin, and retention. Shopify identifies these levers as practical ways to understand ecommerce revenue movement.
Check the comparison period before calling the decline structural. A prior promotional peak can make a normal current period look weak. Compare the calendar, campaign intensity, inventory availability, and product assortment.
Cut bottom-funnel ad spend that fails to produce profitable customers first. Protect channels with positive LTV and contribution margin. Run a one-week survey among recent buyers and lapsed repeat customers, asking what stopped the next purchase. Classify the answers into product, price, delivery, assortment, and service problems, then assign one owner to the largest fix.
Before approving a growth budget, restate the YoY result in units sold. Price increases should not be mistaken for stronger demand.
#Turning YoY Into a Weekly Habit, Not a Yearly Report
YoY becomes useful when you check it while there's still time to steer. Every Monday, log trailing twelve-week revenue against the equivalent prior-year window, flag any metric that drifts more than 10% week over week inside that YoY window, and write one sentence explaining the cause.
Pair that with a monthly 30-minute review of revenue, orders, AOV, conversion rate, and new versus returning customers. A quarterly review can compare your position with the broader ecommerce context, including the market figures discussed earlier.
Keep the ritual simple:
- Record the movement: Capture the current value and the comparable prior-year value.
- Name the driver: Write whether traffic, conversion, AOV, acquisition, or retention caused the change.
- Assign one action: Give the next step to one owner with a deadline.
- Review the result: Keep or reverse the action based on contribution, not excitement.
Use a weekly growth review process to turn the dashboard into an operating rhythm. YoY is most valuable as a compass you check while you can still steer, not as a verdict you read after the ship has docked.
Arlo turns Shopify sales, traffic, customer, and product data into a concise weekly report explaining what changed, why it matters, and which actions deserve attention by urgency and dollar impact. Visit Arlo to replace dashboard-watching with a repeatable YoY review habit.