Growth Rate Calculation for Ecommerce, a Practical Guide
By Arthur Falcone · Founder of Arlo
You're staring at last week's Shopify report, the numbers are moving, and the central question remains annoying because it's simple. Did the store grow, or did one promo, one product drop, or one weird traffic spike make the chart look healthy for a minute? That's the whole problem with growth rate calculation when founders use it badly. The math is easy, the judgment is not.
The part most guides skip is the part that matters. A growth number only earns trust when you know what you're measuring, over what time window, and against which baseline. If those three things are fuzzy, the percentage is just decoration. If they're clear, the number tells you where to spend, what to fix, and what to stop pretending is working.
#Table of Contents
- Why Every Shopify Founder Needs Growth Numbers They Can Trust
- What Growth Rate Calculation Means
- Choosing Between MoM, QoQ, YoY, and CAGR
- Worked Growth Rate Calculations with Real Shopify Numbers
- Separating Real Growth from Seasonal Noise
- Common Growth Rate Mistakes and How to Fix Them
- Turning Growth Numbers into Store Actions
- A Simple Weekly Habit to Keep Growth Honest
#Why Every Shopify Founder Needs Growth Numbers They Can Trust
Monday morning starts the same way for most founders. The dashboard is open, revenue is up or down, and everyone wants a clean answer before the coffee gets cold. The problem is that a single week can lie, especially when a launch, discount, or ad experiment distorts the chart.

A growth number only matters when it answers three questions. What kind of growth is this? What time window are you using? What baseline are you comparing against? If you can't answer those, you're not reviewing growth, you're reacting to noise.
Practical rule: Never celebrate or panic over a growth percentage until you know whether it reflects a campaign, a season, or the actual business trend.
Most mainstream explainers stop at the formula and call it done, which is why so many teams misread their own data. A founder needs a number that survives a real conversation, not a textbook example. That's why weekly review meetings should start with context, then move to the percentage.
Use the comparison mindset you'd use on any operating metric. If traffic rose, ask whether the landing page changed. If revenue rose, ask whether order volume or average order value moved. If repeat customers dipped, ask whether the post-purchase flow slipped. For a cleaner KPI stack, the way metrics connect is laid out in Arlo's ecommerce KPI guide, and that's the right way to think about growth numbers too.
The blunt truth is this. Growth rate calculation is not a math problem first, it's a comparison problem. Once you choose the right comparison, the math is routine.
#What Growth Rate Calculation Means
#Plain-English definition
A growth rate is the percentage change in a metric between two points in time. It shows how much a number moved relative to where it started, which is why it gives a fairer comparison than a raw dollar difference when you are comparing periods. Absolute change tells you how many dollars or units moved. Growth rate tells you how big that move is compared with the starting point.
That distinction matters in ecommerce. A $4,000 lift means one thing when you start at $20,000, and something completely different when you start at $200,000. Same delta, different business meaning.
The standard formula is simple. Take the current value, subtract the previous value, divide by the previous value, then multiply by 100 to express it as a percentage. That is the same as (ending value / beginning value) - 1, then multiplied by 100 if you want the percentage form. Paddle's growth rate formula states the same method clearly.
#Standard formula and examples
Here is the formula in plain form:
Growth rate = (Current value - Previous value) / Previous value × 100
If revenue moved from $20,000 to $24,000, the growth rate is 20 percent. If conversion rate moved from 2 percent to 2.5 percent, the growth rate is also 25 percent relative to the starting value, even though the business meaning is very different. Same formula, different operational impact.
That is why founders should not obsess over the percentage alone. A metric can rise at the same rate and still change the business in very different ways. Revenue, sessions, orders, conversion rate, and average order value can all use the same formula, but each one pushes a different lever inside the store.
Bottom line: The formula is simple. The hard part is deciding which metric deserves the formula in the first place.
One catch matters immediately. This standard formula assumes a positive starting value. When the baseline is zero or negative, the math breaks or becomes misleading, which is exactly where many startup and ecommerce cases live. For that reason, founders need to check the baseline before they treat any growth number as real. Performance benchmarking helps put those comparisons in context, and you can use performance benchmarking for ecommerce stores to anchor the number against the right reference point.
#Choosing Between MoM, QoQ, YoY, and CAGR
#Which metric fits which question
Not every growth rate answers the same question. Month-over-month, quarter-over-quarter, year-over-year, and CAGR each belong in a different conversation, and founders get into trouble when they use the wrong one because it feels familiar. You don't need more metrics. You need the right one.
MoM is for fast-moving change. It catches campaign shifts, offer tests, and sudden operational problems while they're still fresh. It's the right lens when you need a quick read on whether a change is landing. The trap is that it can overreact to noise, so it's a weak signal when seasonality is strong.
QoQ smooths out monthly messiness. Use it when the change took time to show up, like a checkout redesign, a subscription launch, or a major merchandising shift. It gives you a cleaner read than MoM, but it still isn't a substitute for seasonal comparison.
YoY is the fairest comparison when seasonality matters. Holiday stores, event-driven brands, and subscription businesses often need to compare the same period across years because a month in isolation can lie. If you sell into a seasonal cycle, YoY is usually the first number to trust.
CAGR is for multi-year growth. It's the annualized pace between two positive endpoints, which makes it useful when you want to know how fast the business has compounded. One source notes the annual average growth rate formula as (ending value / beginning value) raised to the power of 1/N, minus 1, where N is the number of years, while another explains annual percentage growth as total percent growth divided by N. The University of Oregon's growth-rate notes make the difference between multi-year change and one-year change obvious.
| Metric | Best Time Window | Best Use Case | Most Common Mistake |
|---|---|---|---|
| MoM | One month to the next | Campaign checks, launch tracking, quick operational reads | Treating noise like trend |
| QoQ | One quarter to the next | Strategic changes that need time to settle | Using it for highly seasonal stores without context |
| YoY | Same period last year | Seasonal businesses and fair comparisons | Ignoring category shifts or changed assortment |
| CAGR | Multiple years | Long-term compounding and planning | Using it when the starting value is zero or negative |
For performance context, comparing your store against the right benchmark matters just as much as picking the right period, which is why performance benchmarking for ecommerce belongs in the same weekly review. Pick the metric that matches the question, not the one that looks prettiest on the slide.
#Worked Growth Rate Calculations with Real Shopify Numbers
#A normal revenue lift
Start with a clean case. Revenue moved from $180,000 in March to $216,000 in April. The math is simple, ($216,000 - $180,000) / $180,000 × 100 = 20%. That is a normal month-over-month lift, and it is the kind of number you can usually trace back to a paid social push, a stronger offer, or a better product mix.
The percentage is not the point. The question is what changed enough to create it. If you see this kind of move, check the channel that brought in the most new sessions, then look at conversion and average order value before you congratulate yourself. Growth without source-level clarity is just an expensive guess.
#The zero-baseline problem
Now the case that breaks sloppy guides. A new TikTok channel produced $0 in May and $12,000 in June. The naive growth formula does not help here, because dividing by zero makes the result meaningless. Investopedia's growth rate explainer calls out the problem directly, and the same issue shows up any time the starting value is zero or negative, because relative-growth formulas and CAGR both depend on a valid starting point.
Do not force a fake percentage onto a zero baseline. Use absolute change instead, then compare the channel's contribution against total revenue, not against its own nonexistent starting point. If the new channel is still small relative to the whole store, it is promising, not significant.
#A multi-year compounding example
Here is the compounding version. Revenue grew from $900,000 three years ago to $2,000,000 today. Using the annual average growth formula from the University of Oregon, the multi-period annualized growth rate comes out to roughly 30% per year, which is the right way to express compounding across years rather than months.
That number tells a founder what the business pace feels like over time, not just what happened in one quarter. It is the right answer when you want to know how long a store has been compounding, or whether growth is strong enough to support more inventory, team, or paid acquisition. When you see multi-year growth, use it for planning, not applause.
#Separating Real Growth from Seasonal Noise
#Why baselines lie
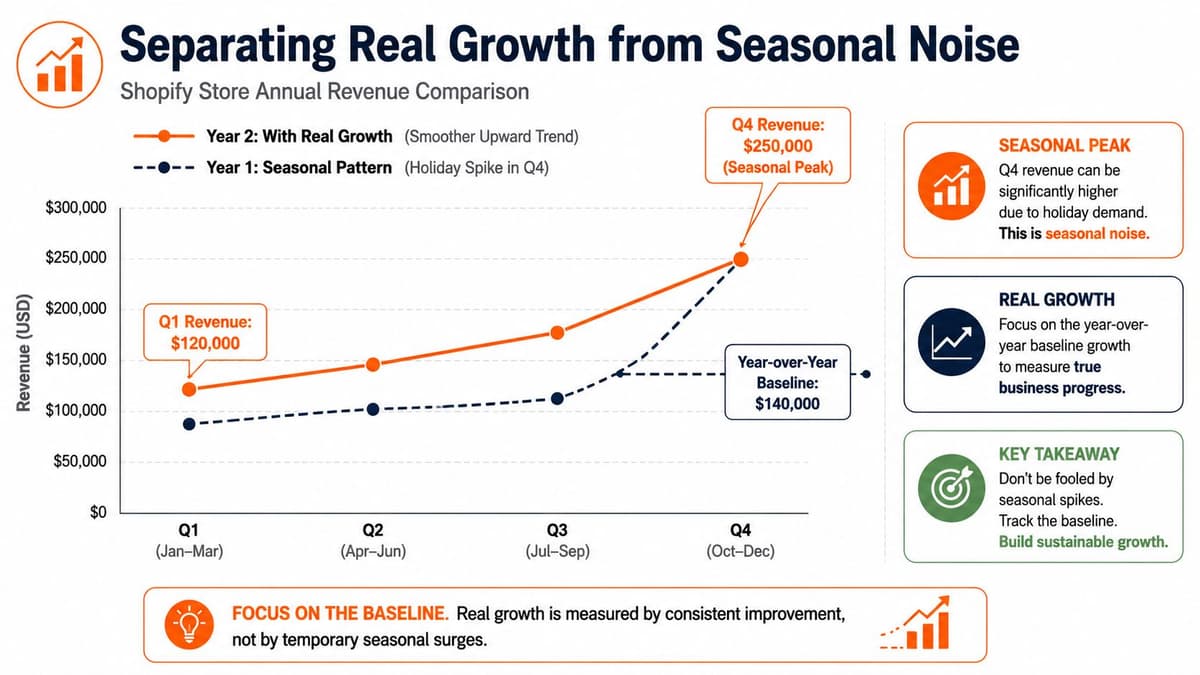
A growth rate is only honest if the baseline is honest. Ecommerce is noisy by nature, and the wrong comparison window can make a healthy store look weak or a flat store look explosive. Recent U.S. ecommerce data shows exactly why this matters. U.S. ecommerce sales reached about $304.2 billion in Q1 2026, up 6.1% from Q1 2025, while ecommerce still represented 16.2% of total retail sales, so a single month can easily misrepresent the trend if seasonality isn't controlled for PMC article on ecommerce volatility and growth interpretation.
That's why seasonal businesses should lean on YoY comparisons first. January compared with December will almost always mislead you if the store has holiday-heavy revenue. November compared with October can exaggerate success for the same reason. The comparison is wrong, so the conclusion is wrong.
#How to spot spikes
One-off spikes need suspicion, not applause. A viral product post, a big wholesale order, or a paid traffic surge can create a growth percentage that looks durable when it isn't. The fix is simple, compare the current period to the same period last year whenever seasonality is in play, then add a rolling four-week average so one weird week doesn't control the story.
Practical rule: If a single week shows extreme growth, don't treat it as a trend until the next few periods confirm it.
The reason multi-period views matter is that growth and level are not the same thing. A store can stay at a high level without really accelerating further, and the chart can still look exciting. That's especially true in ecommerce, where promotions, launches, and shipping deadlines can distort weekly readings.
The clean habit is to track the smoothed line and the comparison line together. If both move up, you've probably got real growth. If only the spike moves up, you've got a timing problem, not a business breakthrough.
#Common Growth Rate Mistakes and How to Fix Them
#The five mistakes that waste time
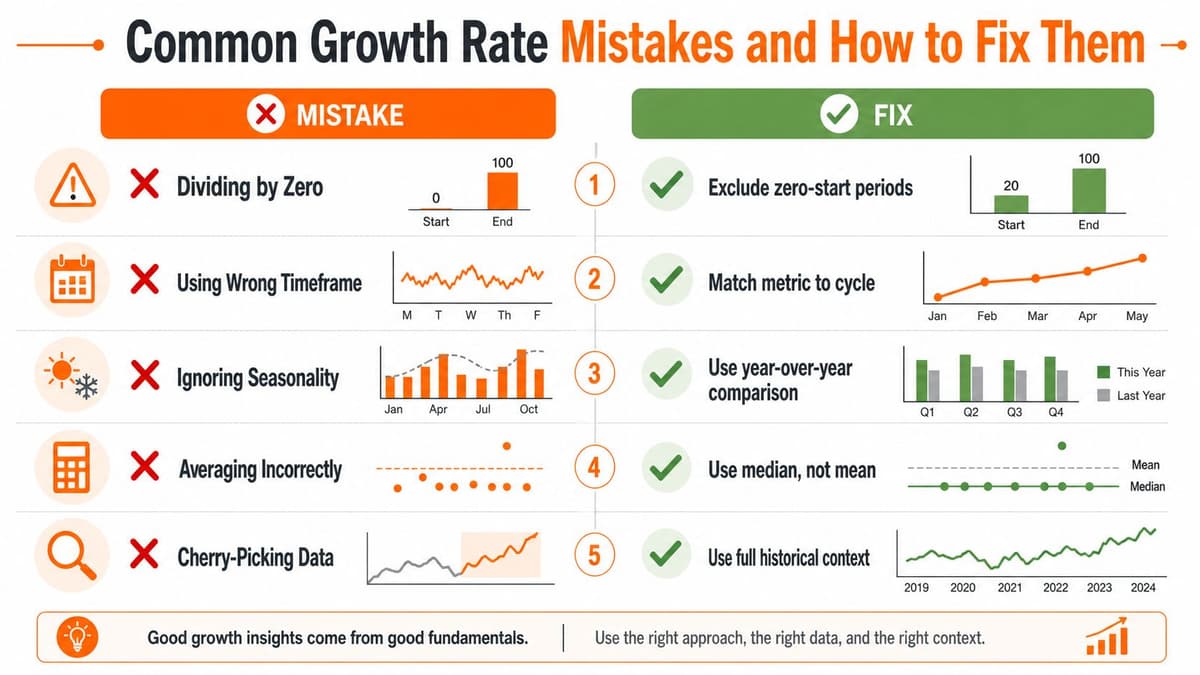
The same errors show up store after store, and they waste weeks. The first is dividing by zero. A launch channel, a new product, or a brand-new store cannot produce a meaningful relative growth rate off a zero base. Use absolute change instead, then compare that line against total revenue rather than pretending the percentage means anything.
The second is using percentage growth to compare business sizes that are nowhere near each other. A smaller store can post a bigger percentage and still contribute less in dollars. Check absolute contribution and margin first, then use the rate as a secondary read.
The third is averaging percentage growth rates across months. That usually gives you a clean-looking number that does not describe the actual pace. Compare endpoints directly, or use CAGR when you are looking across multiple periods.
The fourth is using MoM on a seasonal business and acting like the result says anything about the trajectory. It does not. Anchor the read on YoY and use a smoother series for month-level decisions.
The fifth is cherry-picking periods until the number looks good. That is a reporting problem, not a growth problem. If the timeline is handpicked, the result cannot be trusted.
| Mistake | What Goes Wrong | Better Fix |
|---|---|---|
| Dividing by zero | The formula breaks or becomes meaningless | Exclude zero-start periods from relative growth |
| Comparing different-sized businesses only by percentage | Small numbers can look more impressive than they are | Check absolute dollars and margin |
| Averaging monthly percentages | The result distorts the true pace | Use endpoints or CAGR |
| Ignoring seasonality | Monthly swings look like trend changes | Compare year over year |
| Cherry-picking periods | The story gets distorted | Keep the full historical context |
If you want a sharper dashboard view, these mistakes show up clearly in a data analytics dashboard setup. Use the metric that matches the business pattern, not the one that flatters the story.
#Turning Growth Numbers into Store Actions
#What to do with the answer
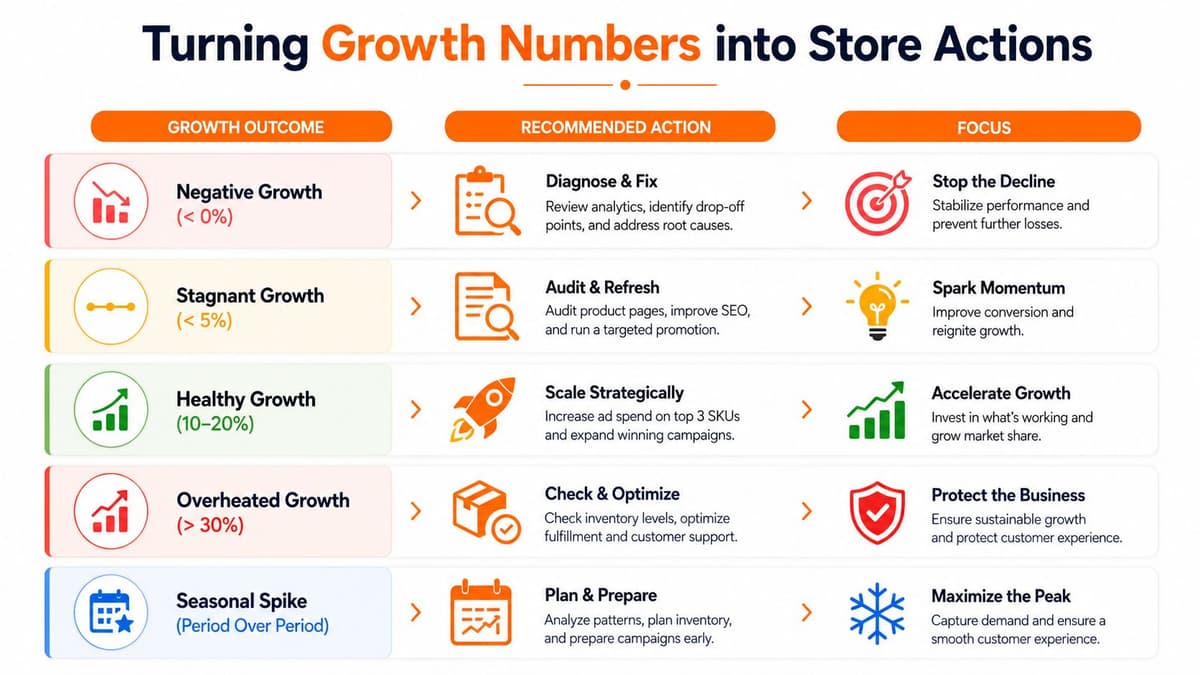
A growth rate is useless if it doesn't change what you do next. If month-over-month revenue growth is clearly strong, the first move is not celebration, it's attribution. Find the channel, offer, or SKU that drove it, then protect the winner before you try to scale it.
If year-over-year revenue is lagging, don't hide behind the excuse that “traffic was up.” That's usually a sign the store is losing share. Audit the top-of-funnel, review the highest-traffic landing pages, and check whether pricing or shipping promises slipped behind competitors. Weak YoY performance means the business is drifting, even if the top line doesn't look catastrophic yet.
If new-customer acquisition is rising while repeat purchase is weakening, stop pushing harder on ads. Fix the post-purchase email flow first. The cheapest growth usually comes from the customers already in the database, and founders who ignore retention end up renting the same revenue over and over.
If a channel is growing fast but contribution margin after refunds and ad cost is flat or negative, pause spend. Scale only after unit economics make sense. A bad margin story can hide behind a good growth story for too long, and that's how stores buy the wrong kind of growth.
Rule of thumb: If the metric looks strong but doesn't improve cash, inventory, or repeat behavior, it's not done earning your trust.
Use the number to decide where to spend your next hour. Scale the channel that worked, fix the page that blocked conversion, repair the email flow that's leaking repeat buyers, or cut the ad set that grew revenue the wrong way. Growth should end in an action inside Shopify or the ad account, not a prettier chart.
#A Simple Weekly Habit to Keep Growth Honest
#The 20-minute review
The best founders don't chase every number. They review the same few numbers every week, in the same order, and they make decisions fast. The Rule of 70 helps keep the horizon realistic. One source states that the years to double are roughly 70 / growth rate, so a brand growing at 14% annually would roughly double in about 5 years, while 10% annual growth implies about 7 years Pearson's Rule of 70 explanation. That's a better planning frame than celebrating a one-week spike.
The weekly habit is short on purpose. Pull the rolling four-week revenue average, compare this week with the same week last year, split new-customer and repeat-customer revenue, and write down three actions before you close the tabs. If you can't name the action, the number wasn't ready for leadership yet.
The cleanest version of that habit looks like this:
- Review the smoothed revenue line: Check the rolling four-week average before you look at a single week.
- Anchor to the same period last year: Use YoY whenever seasonality is part of the business.
- Separate acquisition from retention: New customers and repeat customers should never be lumped together in the same conversation.
This is the part most founders skip, and it's the part that compounds. Growth rate calculation is not a reporting trick, it's a decision routine. Done weekly, it keeps you from overreacting to noise and underreacting to the trends that move the business.
If you want the weekly report to do that work for you instead of forcing you to build it from scratch, Arlo turns Shopify data into a plain-language growth review with prioritized actions. It's built for founders who want the number, the meaning, and the next move in one place, without babysitting dashboards.