Abandoned Cart Recovery Rate: Formula, Benchmarks and Fixes
By Arthur Falcone · Founder of Arlo
Roughly seven of every ten online shopping carts worldwide never become completed orders, and Statista's tracking of global checkout behavior records that level as a standing feature of modern e-commerce rather than a bad quarter. A store generating 1,000 carts should expect about 700 of them to stall before payment.
That's the wrong number to manage. Abandonment tells you how much demand leaks. The abandoned cart recovery rate tells you how much of it you get back, and it's the metric founders quote most confidently and define least carefully. Two stores with similar traffic can report 2% and 12% and both be honest, because they're dividing different orders by different populations.
So treat recovery as a measurement problem before you treat it as a copywriting problem. What follows is the formula with its three hidden choices, a breakdown of what the published benchmarks measure, the device and cohort splits where recovery leaks, the checkout fixes that shrink the leak instead of chasing it, and the holdout structure that shows what your emails caused rather than what they coincided with.
#Table of Contents
- How to Calculate Your Abandoned Cart Recovery Rate
- Recovery Rate Benchmarks and Why Published Numbers Conflict
- Where Your Recovery Rate Leaks by Device and Cohort
- Checkout Changes That Shrink the Pool to Recover
- Email Tactics for Low-Intent and High-Intent Carts
- Estimating the Revenue Impact of Better Recovery
- Set Your Recovery Target and Measure the Lift
#How to Calculate Your Abandoned Cart Recovery Rate
Recovery rate equals recovered orders divided by eligible abandoned checkouts, multiplied by 100. Say you had 1,000 eligible abandoned checkouts across 30 days and 62 of those shoppers placed an order within seven days. That's a 6.2% recovery rate. At a $68 average order value, those orders return about $4,216 in recovered revenue for the month. The arithmetic is not the hard part. Defining "eligible" is, and it's where every benchmark argument starts.
#The three choices that move the number
The window. Seven days after abandonment is the common default, because most recovery purchases land early. A 24-hour window, a 72-hour window and a 30-day window all produce different percentages from the same order data. The shorter window gives you a smaller, more attributable number. Pick one, print it beside the rate, and never compare a 7-day figure to someone else's 30-day figure.
The credit rule. Do you count only orders that followed a message, or any order from the same customer inside the window? The first answers "did the email work." The second answers "how much demand came back." Both are useful. Mixing them in one report is how a store convinces itself a broken flow is performing.
The denominator. Every cart with a product in it, or only checkouts that reached contact information? Shopify takes the narrow definition: an abandoned checkout requires the shopper to have provided contact details, usually an email, without completing payment, and Shopify treats the checkout as abandoned once it stays incomplete for more than 10 minutes. A cart with no email address never enters an email-based denominator, which is why "abandoned cart" and "abandoned checkout" counts diverge so sharply on the same store.
Practical rule: Write the formula, the window, the credit rule and the denominator onto your dashboard before you compare your rate to any published figure.
The same store produces three defensible recovery rates depending on where you draw the cohort line, and each one answers a different question.
| Cohort | Denominator includes | What the rate tells you | When to use it |
|---|---|---|---|
| Cart created | Any cart with items, including browsers | Lowest rate, reflects traffic intent | Judging traffic quality |
| Checkout started | Checkouts with contact information that stayed incomplete for more than 10 minutes | Realistic size of the email audience | Default for recovery email reporting |
| Payment initiated | Checkouts that reached payment and stalled | Highest rate, strongest purchase intent | Diagnosing payment and fee friction |
Pick one row and manage it. Reporting all three in a single blended percentage gives you a number that moves for reasons you can't explain. If you're wiring the flow up inside Shopify, this cart recovery guidance for Shopify merchants walks through the setup mechanics behind each cohort.
#Recovery Rate Benchmarks and Why Published Numbers Conflict
Email recovery benchmarks are difficult to compare because publishers use different denominators. Three sourced email figures range from roughly 3% to 10.7%, while cart abandonment figures measure a different event altogether.
| Source | Year | Reported value | What it measures |
|---|---|---|---|
| Klaviyo benchmark data | 2024 | 3.33% | Placed-order rate from abandoned-cart emails |
| Analyzify data cited by Contentsquare | 2024 | 10.7% | Average conversion rate for abandoned-cart emails |
| Barilliance data reported by SaleCycle | 2024 | About 3% to 5% of emails sent | Emails sent that converted |
| Baymard global cart abandonment | 50-study average | 70.19% across 50 studies | Share of carts not completed, including browsers |
| Statista global checkout data | Latest period | About 70% | Share of carts not completed |
Klaviyo's 2024 benchmark data reported a 3.33% placed-order rate on abandoned-cart emails (recovery rate benchmark compilation). Analyzify data cited by Contentsquare puts the average conversion rate for abandoned-cart emails at 10.7% in 2024 (checkout optimization statistics). Barilliance data reported by SaleCycle shows roughly 3% to 5% of emails sent converting (SaleCycle's email benchmarks).
These figures describe different denominators: placed orders per email, conversions per email, or conversions per recipient. Even when customer behavior is identical, changing the denominator changes the reported rate. Use the figures as reference points, not as interchangeable measures of performance.
Cart abandonment statistics answer another question. Baymard's checkout usability research reports global cart abandonment of 70.19% across 50 studies. That figure includes people who were browsing, comparing prices, or saving items. It measures the share of carts not completed, not the share of shoppers who return after an email.
Compare rates with the same denominator. A rate per email sent cannot be compared directly with a rate per abandoned checkout.
For planning, use 3% to 5% of emails sent as a working reference, and treat 10.7% as an upper comparison rather than a target for every cohort. Then calculate your own rate for a defined checkout cohort. To estimate incremental lift, compare recovery in a group that receives messages with a holdout group that does not. That separates orders the recovery flow helped generate from purchases that would have happened anyway.
#Where Your Recovery Rate Leaks by Device and Cohort
Device splits are the most common place a blended recovery rate hides its real problem. For luxury apparel in the fourth quarter of 2024, mobile abandonment ran at approximately 80%, against about 70% on computers, and luxury handbags followed the same mobile-over-desktop pattern, according to Statista's luxury cart abandonment data. Those are luxury categories, not your catalog, so take the direction as the finding and test the size in your own numbers.
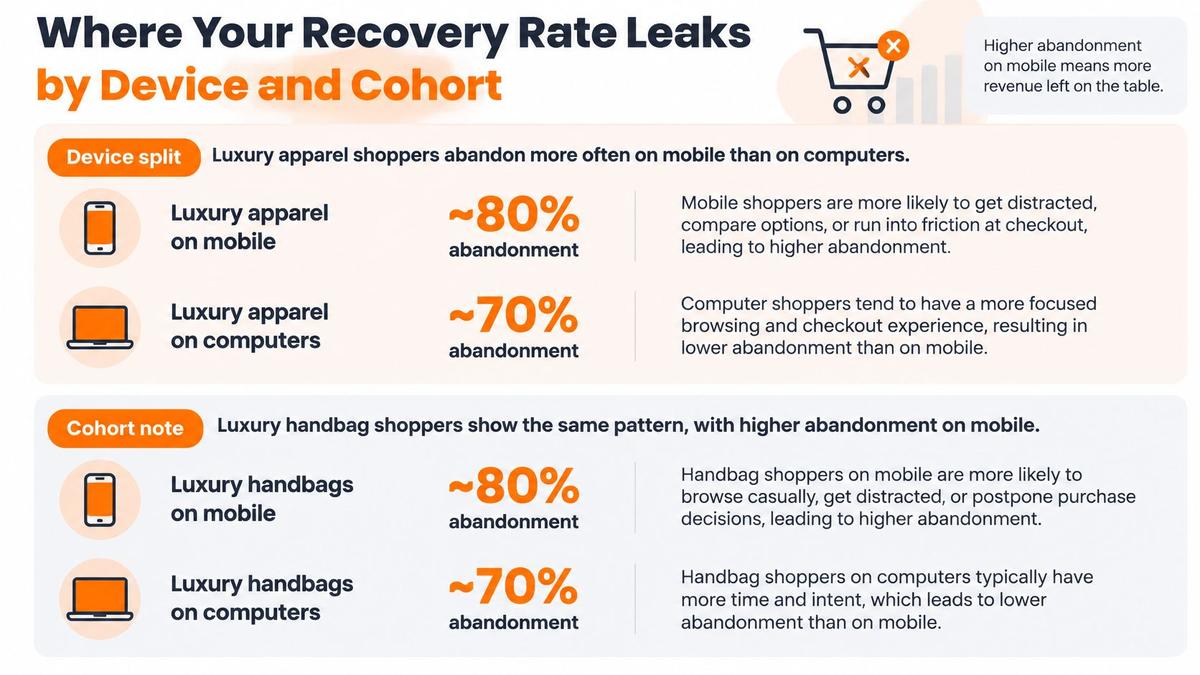
The mechanism is not mysterious. Mobile shoppers type on smaller keyboards, get interrupted by notifications, switch apps to check a shipping address, and abandon when form validation throws an error they can't see. A recovery program that sends identical reminders to a phone cart and a laptop cart is measuring an average of two different problems.
#The segments worth cutting before anything else
Segment recovery reporting by device, checkout step, browser, payment method, traffic source, cart value, new versus returning customer, and the last recorded event before abandonment. That's more columns than most dashboards show, so start with the five signals below and rank them by lost revenue.
| Segment | Signal | Likely cause | First check |
|---|---|---|---|
| Mobile carts | Abandonment well above desktop | Small screens, slow form entry, app switching | Session replay of the mobile address step |
| Carts stalling at address | Drop concentrated at step two | Too many fields and validation errors | Field-level error counts by device |
| Carts stalling at payment | Drop after payment is initiated | Missing payment methods or cost surprises | Payment methods offered against your audience |
| Browsers without checkout | Cart created but checkout never started | Low intent, price comparison | Recovery results for the cart-created cohort only |
| Returning customers | High abandonment among repeat buyers | Forced account creation or login friction | Whether guest checkout is available |
#A healthy rate can hide a broken checkout
Here's the pattern to watch for. Shoppers drop at the mobile address step, so they never reach payment, and most never receive a reminder because they never supplied an email. The handful who do supply one get chased, some convert, and the recovery rate looks respectable. The bigger loss never entered the numerator or the denominator.
That's why the segment detail matters more than the total. Rank your three biggest drop points over the last 30 days by revenue at risk, not by abandonment percentage. A step losing 300 carts worth $40 each outranks one losing 500 low-value carts, and the ranking tells you which fix to attempt first.
#Checkout Changes That Shrink the Pool to Recover
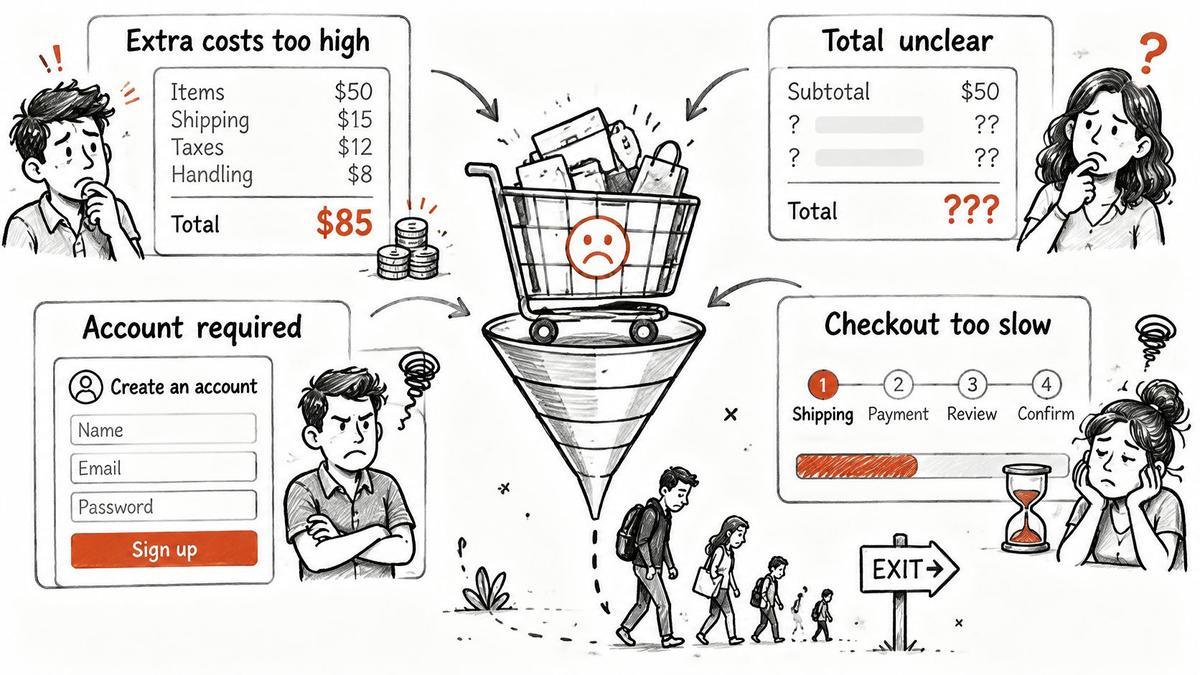
Every recovery email is a second attempt at a sale the checkout already lost, and some of those losses are structural. Shopify's checkout optimization guidance, drawing on Baymard's research, attributes abandonment to four fixable causes: 40% of shoppers left because extra costs were too high, 12% couldn't determine the total cost upfront, 18% were blocked by a required account, and 17% found the process too long.
A stronger subject line does not fix any of those.
#Cost surprises first, because they cost the most
Extra costs are the largest reason in that list, so put landed cost on the cart page: shipping, tax, and the final total, visible before anyone types an address. If the shipping rate depends on destination, show the cheapest option and the range. If free shipping starts above a threshold, show how far the cart is from it. Shoppers who already see the total have no price surprise left at payment.
That change also changes the recovery math. Fewer carts die over a fee they never expected, so the abandoned cohort left for email is smaller and less dominated by cost shock. Judge the fix by checkout completion on the revised cart page against a holdout that still sees the old total, not by whether the recovery percentage rises.
#Then the wall in front of the account
Guest checkout sits beside the account option, not behind it. Offer the account after purchase, where the incentive is order tracking and a faster repeat checkout. Forcing registration on a first order trades a small data gain for a lost sale, and shoppers have already named that wall as a reason they leave.
#Then the form itself, which is usually too long
Baymard's usability testing found that an optimized checkout can be reduced to roughly 12 interface elements: 7 fields, 2 checkboxes, 2 drop-downs, and 1 radio-button control, per Baymard's e-commerce checkout usability report. Add express wallets so returning mobile shoppers never type an address, persist cart state across devices so an interrupted session resumes rather than resets, and log field-level validation errors so the address step shows up in your reports instead of hiding inside a drop-off.
Count the effect inside the cohort that hits the shortened form. Completion among those sessions, minus completion in the holdout, is the incremental lift. A headline recovery rate will not show it, because shoppers who now finish checkout never enter the abandoned denominator.
For the deeper diagnostic work, this breakdown of the most common checkout abandonment reasons maps each failure point to the field-level evidence that confirms it. And when you test a change, test it properly: A/B testing for ecommerce conversions covers how to structure a checkout experiment so the result isn't noise.
Fix the largest reason in your own data first. Confirm abandonment falls in the treated cohort before you add another reminder, because more email on top of a broken form only chases the shoppers who got far enough to leave an address.
#Email Tactics for Low-Intent and High-Intent Carts
One sequence for every cart is the most common structural error in recovery email. Baymard's cart abandonment research found that 42% of U.S. online shoppers abandoned a cart in the previous three months because they were "just browsing" or not ready to buy. Among the rest, the barriers get specific: 20% cited slow delivery and 19% said they didn't trust the site with card details, alongside cost concerns.
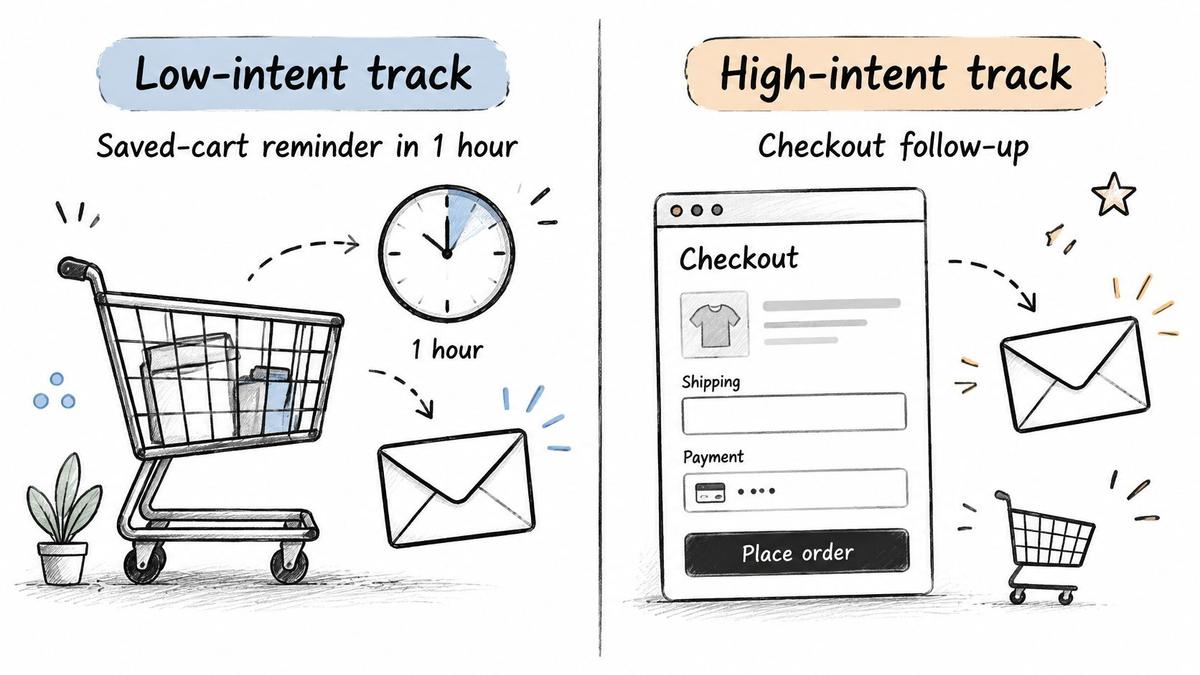
Those two populations need different messages, different timing and different offers. Build two tracks.
#The low-intent track for carts that never reached checkout
These shoppers left a product behind without ever supplying an email at the payment step, which means the message has to earn attention rather than close a sale. Send a saved-cart reminder about an hour after abandonment with no discount. Follow at 24 hours with reassurance on returns and reviews, still no offer. Send a final reminder at 72 hours. The screenshot of the cart does more work than any percentage off, and discounting a browser teaches your list to wait for the next code.
#The high-intent track for checkouts that stalled at cost or delivery
This shopper reached shipping, tax or payment and stopped. The first message goes out within 60 minutes and states the full landed cost and the delivery date in the body of the email, before any link gets clicked. Hold the discount back. If the stall was a cost surprise, the fix is transparency, not margin.
| Track | Message | Timing | Offer |
|---|---|---|---|
| Low-intent | Saved-cart reminder | About 1 hour after abandonment | No discount |
| Low-intent | Reassurance on returns and reviews | 24 hours | No discount |
| Low-intent | Final reminder | 72 hours | Discount only if the holdout shows a gap |
| High-intent | Landed cost and delivery date clarification | Within 60 minutes | No discount at first |
| High-intent | Discount capped at gross margin after shipping and message cost | Only after the first two messages, and only if the holdout shows a gap | Capped at margin |
Hold out roughly 10% of eligible carts at random from the start, so the lift gets measured rather than assumed. Without a holdout, every recovered order looks like your email's work, including the ones that would have converted on their own.
Launch the high-intent track first. It has the clearer causal barrier, the shorter feedback loop and the better margin profile. If you want to extend segmentation beyond the cart itself, these AI insights in ecommerce show how customer-level signals change which offer a shopper should see. For teams still assembling the surrounding automation, this guide to small business marketing automation covers how the cart flow fits with welcome, post-purchase and winback sequences.
Add a discount only where the holdout proves a gap that price transparency didn't close.
#Estimating the Revenue Impact of Better Recovery
The numbers in this section are illustrative, and that's the point. Run the same structure on your own data and the answer belongs to you instead of a benchmark article.
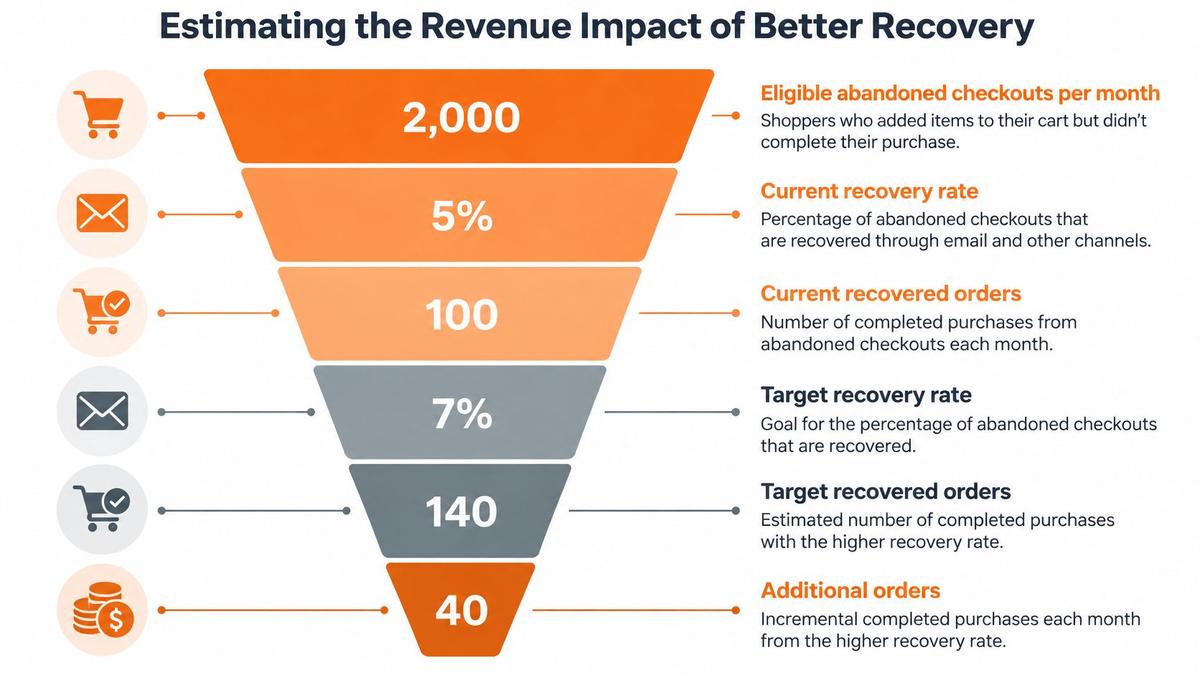
Take 2,000 eligible abandoned checkouts a month at a current 5% recovery rate, which is 100 recovered orders. A target of 7% gives 140. The 40 additional orders at a $68 average order value add $2,720 in revenue, and at a 50% gross margin about $1,360 in gross profit. That's the headline. Now subtract what the lift cost: discount value given on recovered orders, email platform spend, and any shipping subsidy attached to the offer. A $1,360 gross-profit gain with $600 of discount and platform cost is a $760 project, which may or may not justify the checkout work.
#What the holdout does to the same math
Hold out 200 carts and message the other 1,800. The held-out group converts at 2%, so 4 orders. The messaged group converts at 6%, so 108 orders. Apply the 2% baseline to the 1,800 messaged carts and you'd have expected 36 orders without any email. Only 72 of the 108 are incremental.
That's a 48% haircut on the number most dashboards report, and it changes how you rank projects. A checkout fix that lifts the whole funnel by a point now competes directly against a discount that buys incremental orders at half the margin.
The test that settles it: recovered gross profit minus discount, platform and shipping cost, compared against the same figure for the holdout, over at least four weeks.
Walk the funnel in order: eligible carts, recovered orders, incremental recovered orders, recovered gross profit, net of cost. Report all five and the headline rate becomes a summary rather than the goal.
#Set Your Recovery Target and Measure the Lift
- Pick the cohort you'll manage. Checkout started is the default for most DTC brands, because it matches the audience your emails can reach.
- Write the window beside it. Seven days after abandonment is a reasonable start. Put it in the metric name so nobody forgets.
- Record a 90-day baseline for that cohort. Recovered orders, recovered gross profit, and the rate itself. All three, not just the percentage.
- Set a target against your own baseline. Published benchmarks get you oriented; your own trend is what you're improving. A modest gain is a sensible first milestone.
- Run the change against the randomized holdout for at least four weeks. Then compare incremental recovered gross profit, not the headline rate.
- Fix the largest leak from your segmentation before you touch the reminder sequence again. Give that fix four to six weeks before you re-score, since checkout changes need enough traffic to separate signal from noise.
- Set a review date and write the target, cohort, window and test dates in your dashboard this week. A review with no written baseline is an opinion.
Our weekly score runs every Monday on your live Shopify data, ranks the action items by dollar impact, and tells you what to fix that week, which is how a recovery target stays attached to the leak that's costing you orders. If you want the reporting layer that supports steps three through five, this guide to ecommerce analytics covers cohort and holdout reporting alongside the rest of your store metrics.
Three definitions decide whether your recovery rate is a real measurement or a number that moves for unexplained reasons: the cohort, the window and the credit rule. Arlo exists to make that call for you, connecting to your Shopify store and producing a weekly analyst report that ranks the leaks by dollar impact, including the abandoned-cart flow and the checkout steps feeding it. Visit Arlo to see how a short weekly read turns into a decision you can act on the same week.