Boost Average Order Value: Top Tactics for 2026
By Arthur Falcone · Founder of Arlo
Your store might be getting more orders than it did a few months ago, yet the revenue line still feels stubborn. You refresh Shopify, scan ad performance, maybe blame conversion rate, and still can't explain the gap. In many stores, the missing piece isn't traffic. It's how much each customer spends when they do buy.
That number is your average order value. Founders often discover it late, usually after noticing that more effort isn't creating enough margin. A brand can work hard to bring in new shoppers, only to find that tiny carts, weak bundles, and a clunky mobile checkout are ultimately capping growth.
Average order value matters because it sits between marketing and profit. It helps explain whether your store is getting stronger or only getting busier. It also gives operators a practical question to answer every week: how do we help the next customer buy a little more, without making the experience worse?
#Table of Contents
- Introduction to Average Order Value
- Understanding Core Concept and Calculation of AOV
- Benchmarking AOV and Segmenting by Key Factors
- Why AOV Drives Revenue and Unit Economics
- High Impact Tactics to Increase AOV
- Measurement Testing and Common Pitfalls
- Arlo Weekly Report Examples of AOV Signals and Actions
- Conclusion and Next Steps
#Introduction to Average Order Value
A founder running a Shopify store usually starts with the obvious numbers. Orders. Revenue. Ad spend. Conversion rate. Those matter, but they don't tell the full story of how efficiently the store makes money from each sale.
Average order value tells you the average amount a customer spends per order. That sounds simple, and it is. But simple metrics often do the most work because they reveal where operational decisions are helping or hurting margin.
Consider a store selling skincare. Orders are steady, traffic is up, and paid campaigns are working. But most shoppers buy a single hero item and leave. No cleanser to pair with the serum. No travel size add-on. No threshold incentive. No post-purchase offer. The business is acquiring customers, but it isn't shaping the basket.
Practical rule: If traffic rises faster than profit, check average order value before you buy more traffic.
This metric becomes even more useful when you stop treating it as a single number on a dashboard and start using it as a management tool. It can guide pricing, bundling, free shipping, merchandising, mobile UX, and retention offers. For founders, that's where average order value stops being a report and starts becoming a lever.
#Understanding Core Concept and Calculation of AOV
#What average order value actually measures
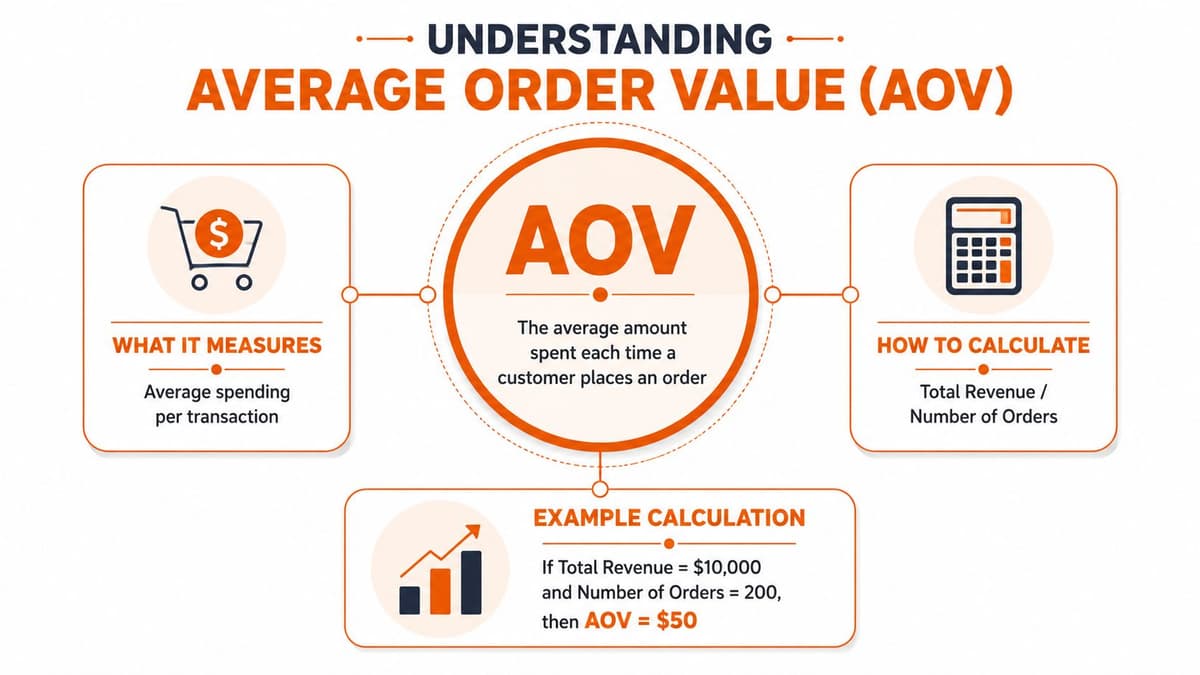
Average order value measures the typical size of a completed transaction. The formula is straightforward: AOV = Total Revenue ÷ Number of Orders. That definition is foundational because it keeps you focused on orders, not sessions, not customers, and not product page views.
A coffee shop analogy helps. If a café brings in revenue from many receipts in one day, average order value asks one question: how much did the average receipt contain? If one person bought only coffee and another bought coffee, a pastry, and beans to take home, AOV smooths those receipts into one average figure.
That same logic applies to ecommerce. A store with the same traffic and the same number of orders can produce very different revenue depending on basket size. That's why average order value is such a useful operational metric.
The broader market shows why merchants care. The global ecommerce average order value reached about $144.57 as of November 2024, up 8.7% from the prior year, and climbed to around $150 by late 2025 according to Speed Commerce's ecommerce average order value benchmarks.
#The formula and the common reporting trap
The arithmetic is easy. The messy part is deciding what counts as revenue in your calculation.
Founders often pull a number from Shopify, another from a spreadsheet, and a third from an analytics tool. Then they wonder why all three disagree. The answer is usually methodological, not mysterious. Some teams include shipping. Some exclude it. Some use gross sales. Others use net revenue after refunds or discounts.
Use one reporting standard and document it. A short internal note is enough:
| Reporting choice | What to decide |
|---|---|
| Revenue basis | Gross sales or net revenue |
| Shipping treatment | Included or excluded |
| Time period | Daily, weekly, monthly, or campaign window |
| Order scope | All orders or a filtered segment |
A clean workflow looks like this:
- Pick the period. Use a consistent window such as the last full month.
- Confirm the revenue field. Don't switch between gross and net without noting it.
- Count completed orders. Use the same order status each time.
- Record the formula output. Save it in one dashboard or sheet.
- Tag the method. Write whether shipping is included.
If your team can't explain how AOV was calculated in one sentence, don't trust the comparison.
That last step sounds fussy, but it prevents bad decisions. AOV is only useful when the number means the same thing every time you review it.
#Benchmarking AOV and Segmenting by Key Factors
#Why benchmarks confuse founders
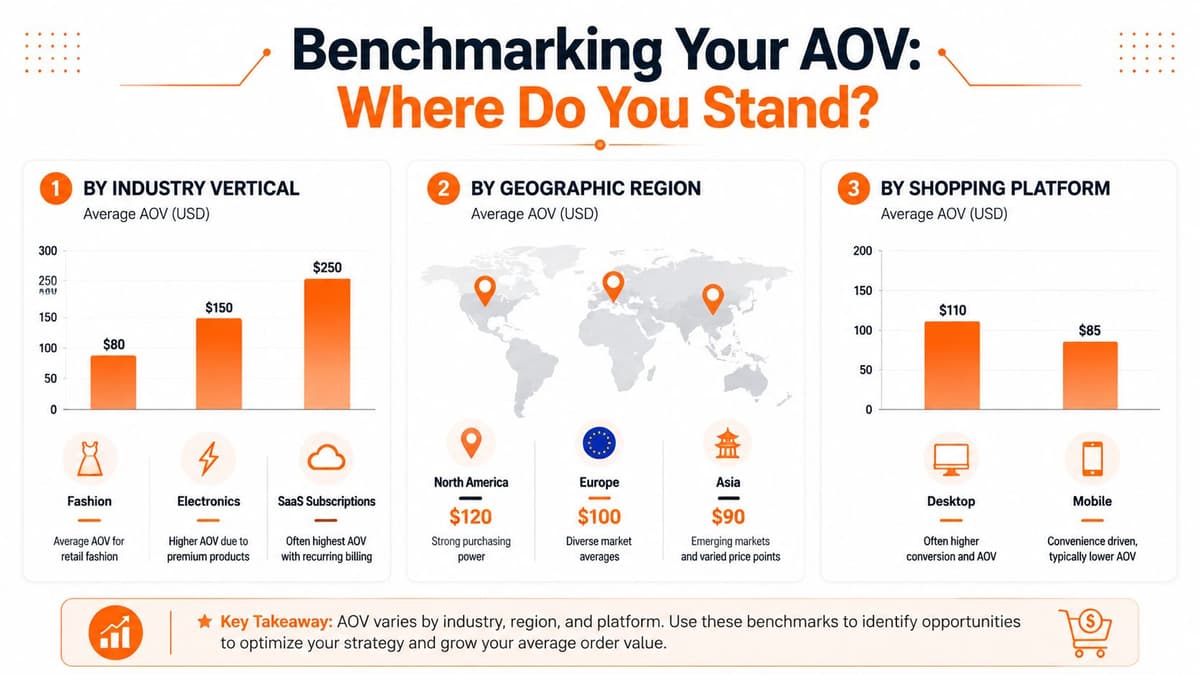
Once you know your own number, the natural next question is whether it's good. That question gets messy fast because average order value shifts dramatically by category, market, platform, and season.
Industry variation alone is huge. Across ecommerce verticals, AOV ranges from $58 at the low end to $418 at the high end, with an unweighted mean of around $182 across eight major industries according to ClickPost's average order value by industry benchmark roundup. A beauty brand and a luxury brand may both run healthy businesses while sitting at opposite ends of that range.
Shopify founders often compare themselves to broad ecommerce averages and draw the wrong conclusion. A store on Shopify can have a lower AOV than a marketplace, a luxury retailer, or a desktop-heavy catalog business and still be performing well for its niche.
A useful benchmark isn't the biggest number you can find. It's the fairest comparison. That's a very different exercise.
#The segments that make your benchmark useful
The most helpful AOV analysis doesn't start with the company average. It starts with slices that let you compare like with like.
Here are the segments worth reviewing first:
- By product category: A starter product line often pulls AOV down, while premium collections raise it. Keep those separate.
- By geography: Customer behavior, pricing, and currency all change basket size.
- By device: Mobile and desktop shoppers don't behave the same way.
- By customer type: New customers usually need different basket-building prompts than repeat buyers.
- By season or campaign window: Promotions and gift periods can distort your normal baseline.
A simple comparison table helps teams spot priorities quickly:
| Segment | What it can reveal | Common next move |
|---|---|---|
| Category | Which collections naturally carry larger baskets | Build bundles around high-attach products |
| Device | Whether mobile shoppers buy fewer add-ons | Simplify cart and upsell flow on small screens |
| Region | Whether local pricing or shipping changes order size | Adjust threshold offers by market |
| New vs returning | Whether retention offers deepen basket size | Create tailored offers for repeat customers |
One caution matters here. Don't benchmark your whole store against an all-industry number and call it strategy. Compare your mobile traffic to your mobile baseline. Compare subscription buyers to subscription buyers. Compare holiday AOV to the same period last year if your business is seasonal.
Benchmarking works when you narrow the comparison, not when you broaden it.
That's how average order value becomes actionable. Not as a vanity stat, but as a segmented map of where bigger baskets are already happening and where friction is suppressing them.
#Why AOV Drives Revenue and Unit Economics
#AOV changes the math of growth
Revenue growth doesn't always require more visitors. Sometimes it requires making better use of the customers you already paid to acquire. That's why average order value sits so close to unit economics.
If a shopper already clicked the ad, browsed your store, and completed checkout, the hard part is done. Any thoughtful increase in basket size can improve the economics of that order without requiring another acquisition cycle. That's especially important for founder-led brands watching cash carefully.
Think of it this way. Traffic acquisition is like filling a bucket with water. Average order value determines how much the bucket holds before it spills over in costs. The fuller each order becomes, the more room you have to absorb fulfillment, creative testing, and channel volatility.
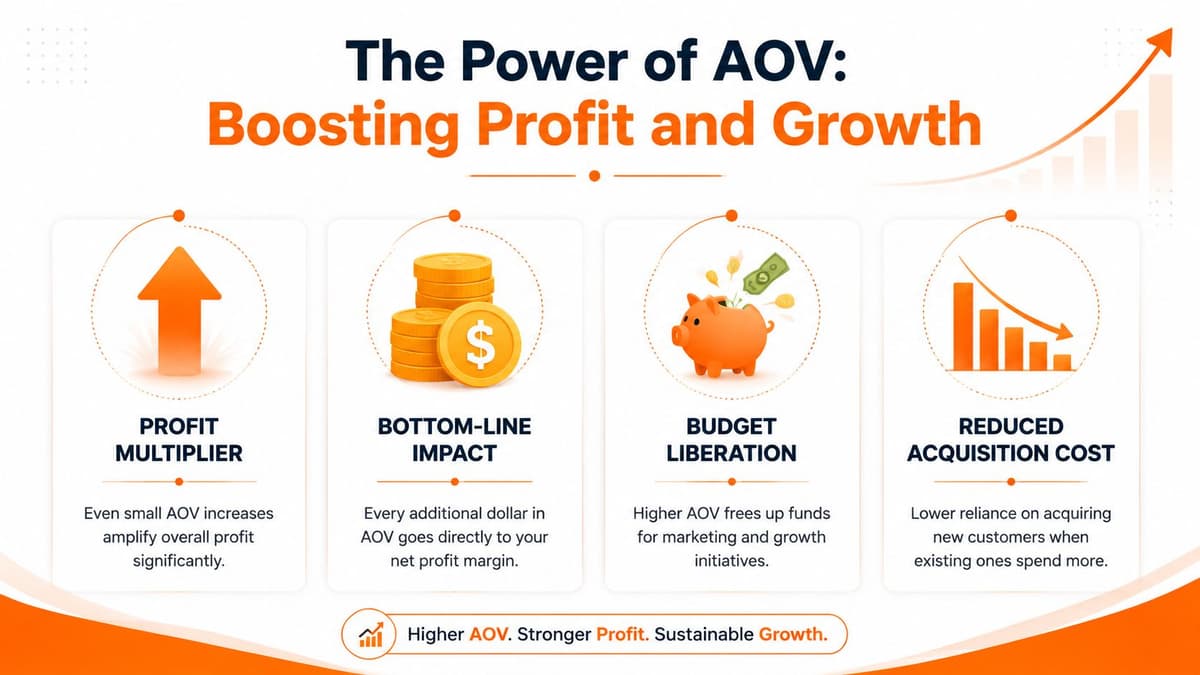
Founders usually feel this before they model it. A slightly larger cart often creates breathing room. It can support stronger paid media decisions, make discounts less dangerous, and reduce pressure to chase top-line growth at any cost.
#The device gap that turns into lost revenue
One of the clearest examples of AOV affecting revenue comes from device behavior. Desktop shoppers generate an average order value of $192 per order, while mobile shoppers average $133, creating a $59 gap according to Ringly's 2026 ecommerce AOV statistics.
That gap matters because many Shopify brands are mobile heavy. If mobile shoppers routinely buy fewer add-ons, skip bundles, or abandon threshold offers because the experience is cramped or confusing, the store is leaving money on the table with every completed order.
Common causes are familiar:
- Weak bundle visibility: The add-on offer sits too low on the page.
- Cart friction: The drawer hides the upsell or makes editing annoying.
- Slow discovery: Shoppers can't easily compare variants or related items.
- Interruptive checkout paths: Too many steps reduce willingness to add one more product.
A founder doesn't need a complicated financial model to act on this. If desktop orders are naturally larger, study what the desktop experience makes easy and then port the essentials to mobile. Show one high-fit add-on, not five. Keep the offer visible. Reduce taps. Make threshold progress obvious.
AOV optimization often beats traffic growth in efficiency because it improves revenue at the moment of purchase. When that improvement happens on the device that drives most of your sessions, the effect shows up quickly in the business.
#High Impact Tactics to Increase AOV
The strongest AOV tactics don't feel like tricks. They help customers assemble a better order with less effort and clearer value.
#Start with offers that make buying easier
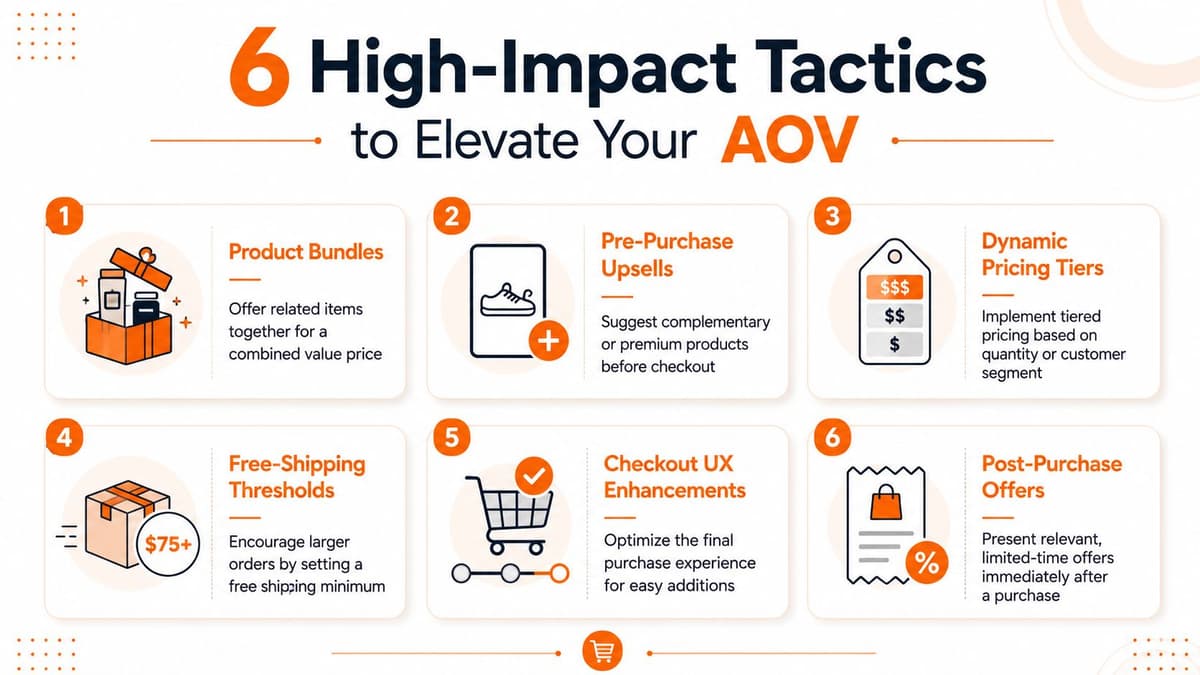
Bundles work because they reduce decision fatigue. A skincare brand can pair cleanser, serum, and moisturizer into a routine rather than forcing the shopper to assemble one from scratch. A coffee brand can group beans, filters, and a mug into a starter kit. The bundle should answer a customer job, not just stack products together.
Pre-purchase upsells belong close to the buying moment. Good examples include a larger size, a compatible accessory, or a replenishment add-on. Keep the copy plain. "Add the travel case" usually beats clever phrasing because it explains the value instantly.
Dynamic pricing tiers can help when customers naturally buy multiples. This works well for consumables, giftable products, and replenishment categories. The message should show the logic clearly, such as better value when buying several units, without making the page feel like a wholesale catalog.
For product pages, strong writing matters because it shapes what feels worth adding. If your cross-sell copy is vague, the upsell won't land. This guide to writing product descriptions that support better merchandising decisions is useful when your offers exist but aren't converting.
A quick operator checklist:
- Bundle around an outcome: "Morning routine" is stronger than "3-item pack."
- Keep upsells relevant: Suggest the item that removes friction from using the main product.
- Limit options: Too many add-ons often lower take rate.
- Use direct copy: Explain what the extra item does and why it belongs in the order.
For teams that want a broader set of merchandising and conversion ideas, this guide on how to boost your ecommerce sales is a solid companion resource.
#Use thresholds and checkout moments carefully
Free shipping thresholds remain one of the cleanest AOV levers when they're set correctly. Research cited by Sutton Commerce on Shopify free shipping thresholds recommends setting the threshold 20 to 30% above your current AOV to drive larger orders without hurting conversion. If the threshold sits too low, customers reach it without changing behavior. If it sits too high, they ignore it.
The tactic works best when the threshold is visible inside the cart, not hidden in a banner that shoppers forget. A progress message gives customers a clear next step. "You're close to free shipping" is vague. "Add one refill pack to get free shipping" is useful.
Later in the buying journey, checkout UX can either support larger baskets or shut them down. Small changes matter:
- Surface one relevant add-on in the cart drawer
- Keep quantity editing easy
- Avoid cluttered coupon fields that distract from value-building
- Make the shipping incentive visible before final payment steps
This short video gives a practical view of ecommerce AOV tactics in action:
A threshold only works when shoppers can see the gap and know exactly how to close it.
#Don't ignore post-purchase expansion
Most stores focus on what happens before checkout. That's sensible, but incomplete. Post-purchase offers can raise order economics without disturbing the main conversion event.
The key idea is sequencing. A customer who just bought a starter item may be open to a low-friction companion product, a refill, or a premium accessory immediately after purchase. That offer should feel like a continuation of the original decision, not a random second pitch.
The most useful way to think about this is a product orbit. Each core product has nearby products that naturally follow it. Operators should map those relationships and then decide which offer belongs:
- Right after checkout
- In the order confirmation experience
- In a short follow-up email or SMS
- At the likely replenishment window
The practical workflow is simple. Pick your best-selling SKU. List the add-ons that most logically surround it. Write one sentence for each explaining why it belongs with the original purchase. Then test the highest-fit offer first.
Founders often overcomplicate AOV work. In practice, the best gains usually come from a few disciplined improvements. Better bundles. Smarter thresholds. Cleaner mobile checkout moments. A relevant offer after purchase. None of those require a redesign of the whole business.
#Measurement Testing and Common Pitfalls
#A simple testing rhythm
Many stores launch an upsell app, add a cart drawer offer, and assume they've "done AOV." That's not measurement. That's installation.
A better approach is a simple testing cadence. Choose one AOV tactic at a time, define what changed, and compare a clean before-and-after period using the same calculation method. If you change the bundle, the threshold, and the checkout copy all at once, you won't know what moved the result.
Use a short operator rhythm:
- Choose one lever. Example: free shipping threshold or bundle placement.
- Write the hypothesis. Example: clearer cart messaging will increase add-on behavior.
- Run the test long enough to gather stable order behavior.
- Review AOV with conversion rate and product mix together.
- Keep, revise, or remove the change.
Teams that need a cleaner foundation for this work should review how analytics in ecommerce supports consistent decision-making across Shopify and reporting tools.
#The reporting mistakes that distort AOV
One of the biggest AOV pitfalls is hidden in plain sight. Some dashboards include shipping fees. Others don't. That difference can make comparisons misleading, especially across markets with different logistics costs.
According to AppsFlyer's glossary entry on average order value, including shipping fees can inflate AOV by 15 to 25% in high-cost logistics regions, yet only 10% of guides clarify whether benchmarks include those fees. That means two merchants can report very different AOV figures even when underlying product purchasing behavior is similar.
A reporting checklist prevents that confusion:
| Pitfall | What to do instead |
|---|---|
| Shipping mixed into revenue silently | Label whether shipping is included |
| Gross and net revenue used interchangeably | Pick one method and stick to it |
| Whole-store AOV used for every decision | Segment by device, category, and customer type |
| Testing many changes at once | Isolate one change per test cycle |
Report average order value the same way every time, or don't compare it at all.
That's the standard founders should enforce. Precision doesn't make the business slower. It keeps the team from chasing the wrong fix.
#Arlo Weekly Report Examples of AOV Signals and Actions
#Reading the signal instead of staring at charts
Operators rarely need more charts. They need help interpreting what matters first.

A weekly report built for decision-making should highlight AOV signals in plain language. Instead of only showing a number, it should point to likely causes. Mobile carts are smaller than desktop. Bundle uptake is weaker in one collection. Repeat customers aren't taking the post-purchase add-on. Threshold messaging is present, but poorly placed.
That's the difference between reporting and guidance. Reporting says what happened. Guidance helps an operator decide what to change next.
Teams that want a broader view of how this style of analysis works can look at business intelligence reporting for operating decisions.
#Turning a report into a weekly action list
A useful AOV report usually leads to a short, ranked list of actions. Not twenty. Usually three to five.
A founder reviewing an AOV signal should ask:
- Where is the drop occurring most clearly? Device, category, or customer segment.
- What is the likely friction? Weak offer, poor placement, or bad sequencing.
- What is the smallest test worth running this week? One revised bundle, one threshold message, one post-purchase offer.
- What should stay untouched? If one product family already carries strong baskets, protect it.
The best reports also help prevent wasted work. If a team sees that desktop baskets are healthy but mobile add-ons lag, they shouldn't spend the week redesigning desktop PDPs. They should tighten the mobile path to one better add-on decision.
AOV analysis shifts to practical application. The metric stops being a summary of the past and becomes a list of next moves.
#Conclusion and Next Steps
Average order value looks simple on the surface, but it carries a lot of operational weight. It tells you how efficiently your store turns completed orders into revenue. It also forces discipline. You have to calculate it consistently, benchmark it fairly, and segment it well enough to learn something useful.
The most overlooked parts of AOV work are usually the most profitable to fix. Shipping inclusion can distort comparisons. Mobile shoppers often buy smaller baskets than desktop shoppers. Post-purchase offers are underused. Founders who treat these as separate issues miss the pattern. They all shape how much value a store captures from the customer who already decided to buy.
A practical 30-day plan looks like this:
- Week one: Lock your AOV definition and note whether shipping is included.
- Week two: Segment AOV by device, category, and new versus returning customers.
- Week three: Launch one test. Bundle, threshold, cart upsell, or post-purchase offer.
- Week four: Review results, keep the winner, and queue the next test.
Keep the process narrow. One change at a time. One clean method of reporting. One priority list each week.
Founders don't need more dashboards. They need a reliable way to see what changed, why it matters, and what action deserves attention first.
Arlo gives Shopify operators that kind of clarity. Its AI-powered weekly report turns store data into plain-English priorities, highlights what changed across sales and customer behavior, and ranks actions by urgency and revenue impact. If you want a faster way to spot AOV issues, mobile gaps, bundle opportunities, and other profit levers without living in dashboards, take a look at Arlo.