Brand Loyalty Measurement: Metrics, Formulas, Benchmarks
By Arthur Falcone · Founder of Arlo
Ask ten DTC operators how they measure brand loyalty and eight will point at repeat purchase rate. It's on every dashboard, it's what investors ask about, and it's the number loyalty programs get judged by.
It's also the number that misleads most often.
A repeat order proves someone bought twice. It doesn't say whether they came back for the formula, for the reminder email that landed on payday, because the only credible competitor charges double, or because the subscription renewed itself. Repeat purchase is a fact about the past. Loyalty is a claim about the future. Confusing the two is how stores end up paying discounts to people who would have bought anyway.
The second most popular answer, net promoter score, has a different weakness. It records what customers say they'll do. That's worth knowing. It isn't the same as what they do.
I'd rather you measure three things and stop guessing: what customers did, what they tell you they feel, and what changed when you intervened. Keeping those three apart is the whole discipline of brand loyalty measurement.
#Table of Contents
- What Brand Loyalty Means for Your Store
- Core Loyalty Metrics and How to Calculate Them
- Build Loyalty Metrics From Your Shopify Data
- Category Benchmarks and How to Read Them
- Separate Real Loyalty From Discount Dependence
- Customer Lifetime Value Beyond Tenure
- Prioritize Your Next Loyalty Actions
#What Brand Loyalty Means for Your Store

Two regulars visit the same coffee shop every Tuesday. One stops because it is on the way to the station. The other crosses town to get there. Their transactions look identical in the till, but only one suggests a real preference.
That distinction is the measurement problem. In their 1973 study, Jacoby and Kyner examined the conditions required for repeat behavior to count as loyalty, including consistency over time and psychological commitment. Their test of the share of a shopper's purchases going to their most-bought brand did not distinguish four treatment groups significantly across five purchase trials. Repeat buying is evidence of behavior, not proof of preference.
Habit, convenience, discounts, a lack of credible alternatives, and subscription inertia can all produce another order. A rising reorder rate alone cannot tell you which force is at work, and treating them as the same problem can lead to unnecessary discounting.
Separate loyalty into three kinds of evidence:
- Observed behavior: Repeat rate, time between orders, and share of wallet show what customers bought. Shopify data can reveal these patterns without a survey.
- Stated attitude: Trust, preference, and willingness to recommend capture what customers say they feel. UserTesting's 2025 brand loyalty report found that 68% of loyal customers surveyed in the United States, Australia, and the United Kingdom said they would stay with a favorite brand after a price increase. A stated intention still is not a purchase.
- Causal evidence: A test with a control group can show whether a loyalty action produced orders that would not otherwise have happened. This is the strongest evidence that an intervention changed behavior.
Engagement is a separate signal. Email opens and site sessions show attention, not loyalty; customer engagement can exist without a purchase. A customer may interact with a brand repeatedly and still choose a competitor when it is time to buy.
Do this now: Label each metric in your Monday dashboard as observed behavior, stated attitude, or causal evidence. Remove any metric you cannot classify until you can explain what it measures.
#Core Loyalty Metrics and How to Calculate Them
Nine metrics carry almost all the useful information. Fix the definitions once and don't touch the formulas again, because a metric that changes definition every quarter can't be trended.
| Metric | Formula | Window | What it tells you |
|---|---|---|---|
| Repeat purchase rate | Customers with 2 or more orders divided by total customers | Last 90 days | Share of buyers who came back |
| Retention rate | Customers who bought in the prior period and again in the current period, divided by customers in the prior period | Monthly or by cohort | Whether a group keeps buying |
| Churn rate | 1 minus retention rate | Same window as retention | Share of customers who did not reorder |
| Purchase frequency | Orders divided by active customers | Last 12 months | How often the average customer buys |
| Time between orders | Average days between a customer's consecutive orders | Rolling | Replenishment rhythm and when to send a win-back |
| Share of category requirements | Brand orders divided by the customer's total category purchases | Survey or estimate | How much of the category the brand captures |
| Customer lifetime value | Average order value x orders per year x gross margin % x years retained | 12 months, by cohort | Profit one customer group generates |
| Net Promoter Score | Percent promoters (9-10) minus percent detractors (0-6) | Quarterly survey | Willingness to recommend |
| Contribution profit per customer | Revenue minus product cost, discounts, shipping, returns and fees | Cohort, 180 days | Whether loyal customers are profitable |
Repeat purchase rate and retention rate are the two to switch on first. The first tells you whether buyers come back at all. The second tells you whether a specific group did, which is why it survives a burst of new customers that flatters everything else. Churn is the complement, so report one and derive the other; quoting both in one meeting invites two definitions of the same idea.
Time between orders sets the timing of every win-back message you'll ever send. Use the median rather than the mean. A few customers who split one purchase into three orders will drag the average down and have you emailing the rest of the list a week too early.
#Where These Metrics Mislead
Share of category requirements is the only row that has to come from customers rather than your database, since you can't see what they spend elsewhere. Run it quarterly with one survey question about which other brands they bought in the last 90 days.
Customer lifetime value belongs in the comparison column, not the forecast column. Use it to rank cohorts against each other and never to predict what one customer is worth, because multiplying four uncertain numbers produces a confident-looking figure with no real precision.
Net Promoter Score is a survey metric, so it sits in the attitude layer. Treat a falling score as a prompt to check returns and support tickets, not as a revenue forecast.
One popular number is deliberately absent from the table. A Frontiers analysis of social engagement and loyalty found no statistically significant short-term effect of social-media engagement on brand loyalty, and warned that sentiment scoring can miss unexpressed trust. Engagement rates stay out of a loyalty report until you've shown they predict repeat revenue for your store.
When you merge these with paid media figures, Class A Media's guide to compare flow revenue attribution metrics is worth reading first, because blended ROAS and cohort retention are happy to tell contradictory stories. And if you want the single number to start with, the repeat purchase rate is the one I'd build the rest of the report around.
Set three baselines this month: 90-day repeat purchase rate, retention rate by cohort, and contribution profit per customer. Add two survey questions to your quarterly email: how likely the customer is to recommend the store, and whether they'd still buy at a price 10% higher. Keep those answers in a separate column from order data so nobody confuses a stated intention with a recorded purchase.
#Build Loyalty Metrics From Your Shopify Data
The export takes ten minutes. The definitions take an afternoon, and they decide whether the report is worth reading at all.
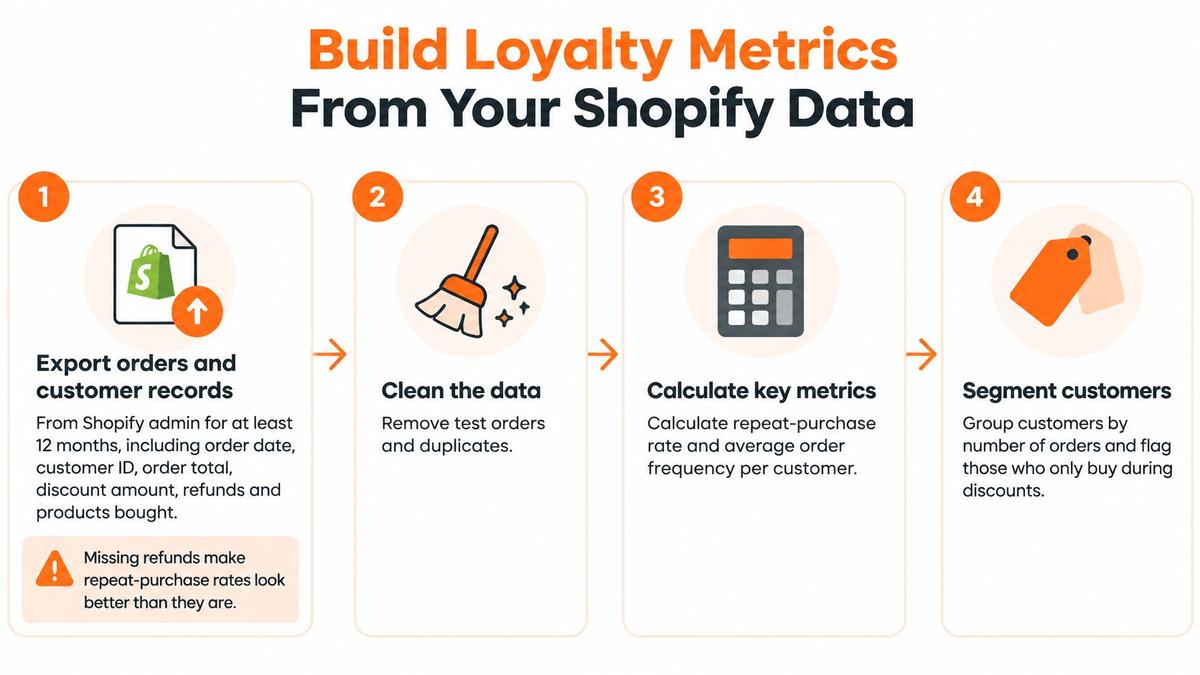
1. Export at least 12 months of orders and customers from Shopify admin. Include order date, customer ID, order total, discount amount, refunds and the products on each order. The mistake at this step is exporting orders without refunds, which flatters every rate downstream and hides the category where returns are heaviest.
2. Assign each customer to a cohort by first-order month, not order month. A cohort is a group that started together, and it's the only way to compare a January buyer's 90-day behavior with a July buyer's without the comparison collapsing.
3. Fix the denominator before counting anything. One standard formulation is customers from the prior period who bought again in the current period, divided by customers in the prior period, as this guide to measuring client retention sets out. You can measure last month's buyers, all active customers at the start of the period, or a fixed first-order cohort. Pick one per report. Mixing them is the most common reason two people in the same meeting disagree about a number that is objectively identical.
4. Count reorders at 30, 60, 90 and 180 days, and report churn beside them. Churn is the share that didn't reorder in the window. The mistake here is publishing a 90-day rate for a cohort that's only 45 days old.
5. Calculate the 90-day repeat purchase rate. Customers with two or more orders divided by total customers over the last 90 days. That figure is the one your category benchmark gets compared against, so it needs to be defined before it's reported.
6. Tag cohorts by acquisition channel, first product, discount use and subscription status. If paid-social cohorts retain at half the rate of email cohorts, your acquisition report needs downstream customer value in it rather than first-order ROAS alone. Getting the joins between order data and traffic data right is the unglamorous part, and this ecommerce analytics setup walkthrough covers the plumbing.
7. Join product cost, shipping, payment fees and returns to reach contribution profit per cohort. Revenue per cohort is a marketing number. Contribution profit per cohort is the one you can spend.
Keep one cohort sheet, updated monthly, with the same columns every time. Consistency matters more than sophistication here, because the value comes from seeing the same line move.
#Category Benchmarks and How to Read Them
| Category | Repeat purchase rate | Email share of revenue | Return rate | Average order value |
|---|---|---|---|---|
| Food & Beverage | 38.0% | 22.0% | 3.0% | $45 |
| Pet | 35.0% | 20.0% | 5.0% | $50 |
| Supplements | 32.0% | 22.0% | 5.0% | $50 |
| Beauty | 28.0% | 20.0% | 8.0% | $60 |
| Fashion | 22.0% | 18.0% | 22.0% | $70 |
| Apparel | 20.0% | 18.0% | 20.0% | $55 |
| Home | 15.0% | 18.0% | 6.0% | $110 |
These medians come from the seven store categories the 20 Minute CMO health score benchmarks against, all scored on the same eight metrics, so a number in one row is comparable to a number in another.
Read down a column, never sideways across a row. A 20% repeat rate is roughly median for Apparel and miles below the Food & Beverage median of 38%. Same number, opposite verdict, because replenishment cadence differs by category and nothing in the data changes that.
#Two Categories, Two Different Lessons
Fashion and Apparel carry return rates of 22.0% and 20.0%. A high order count in those categories can hide returned revenue, so pair repeat rate with return rate before you call anything healthy. A customer who orders five times and returns three is not loyal, they're shopping with your warehouse.
Home has the lowest repeat median at 15.0% and the highest average order value at $110. Nobody buys a sofa twice a year. For Home, a long replenishment window and product education across the catalog matter far more than email volume, and judging the store against a Supplements cadence will produce panic and bad decisions.
One rule per store: if your repeat rate sits five or more points below your category median, retention is your first priority this quarter. If it's above the median, check how much of it comes from discounted orders before you celebrate.
A single snapshot versus a median tells you where you stand. A six-month trend tells you where you're going, and it's the more useful of the two. A 2015 analysis of 26 fast-moving consumer-goods categories in the UK and US, using data periods of six to thirteen years, found average share of category requirements declined by only 0.9 percentage points per year, with changes in polarization and repertoire size not statistically significant. Loyalty does move. It moves slowly, and it doesn't collapse on the schedule that a bad month suggests.
#Separate Real Loyalty From Discount Dependence
Enrollment is not loyalty, and the surveys that treat it as loyalty are measuring intent.
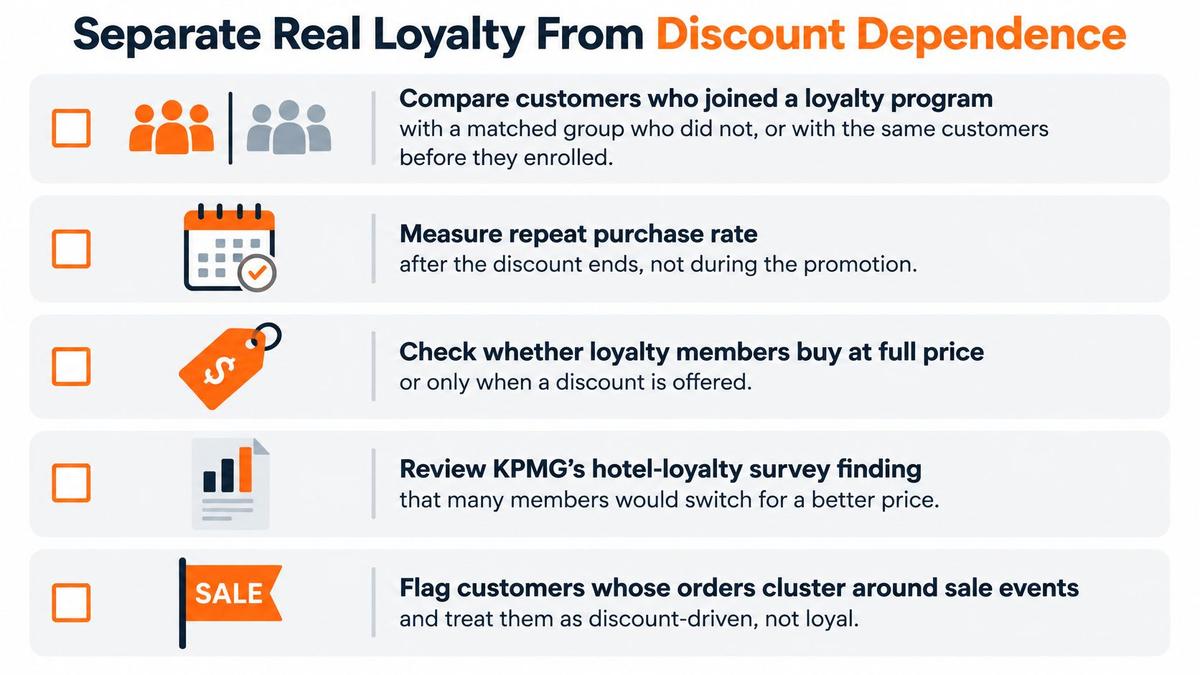
KPMG's survey of hotel loyalty-program customers found 88% of respondents said joining a loyalty program would lead them to continue purchasing from that business, and 83% said they'd recommend brands when the program added value. Both figures come from people already inside a program, describing what they expect of themselves. Deloitte's 2025 survey of 5,564 loyalty-program members found 72% of U.S. consumers said loyalty programs made them more likely to spend with their preferred brand. Intent, again, and a real signal of perceived value, but not a measurement of incremental revenue.
The way to settle it is a matched comparison. Segment customers by enrollment date, then compare 30, 60 and 90-day reorder rates, average order value, gross margin and referral activity against customers who didn't enroll, or against the same customers before they enrolled.
#Three Checks to Run This Week
- Full-price repeat rate. The share of repeat orders placed with no discount attached. If total repeat rate climbs while this falls, discounts are buying the orders, not the customers.
- Category expansion. Whether buyers start adding a second product line. Moving from one SKU to three is the clearest behavioral sign of preference rather than habit, and it's easy to see in Shopify's product report by customer.
- Margin after reward cost. Subtract points redeemed, discount value and free shipping from enrolled customers' orders. A program that grows revenue while shrinking contribution profit per order hasn't built loyalty, it's rented it.
If enrollment doubles, full-price repeat stays flat and margin per order drops, you have your answer. Decide at day 90: keep the reward, redesign it around full-price purchases only, or stop it.
Here's the video walkthrough of how those cohort comparisons play out in practice.
The test that separates preference from promotion dependence is uncomfortable because it sometimes condemns a program everyone likes. Run it anyway. Funding rewards for customers who'd have bought regardless is the most expensive way to feel good about retention.
#Customer Lifetime Value Beyond Tenure
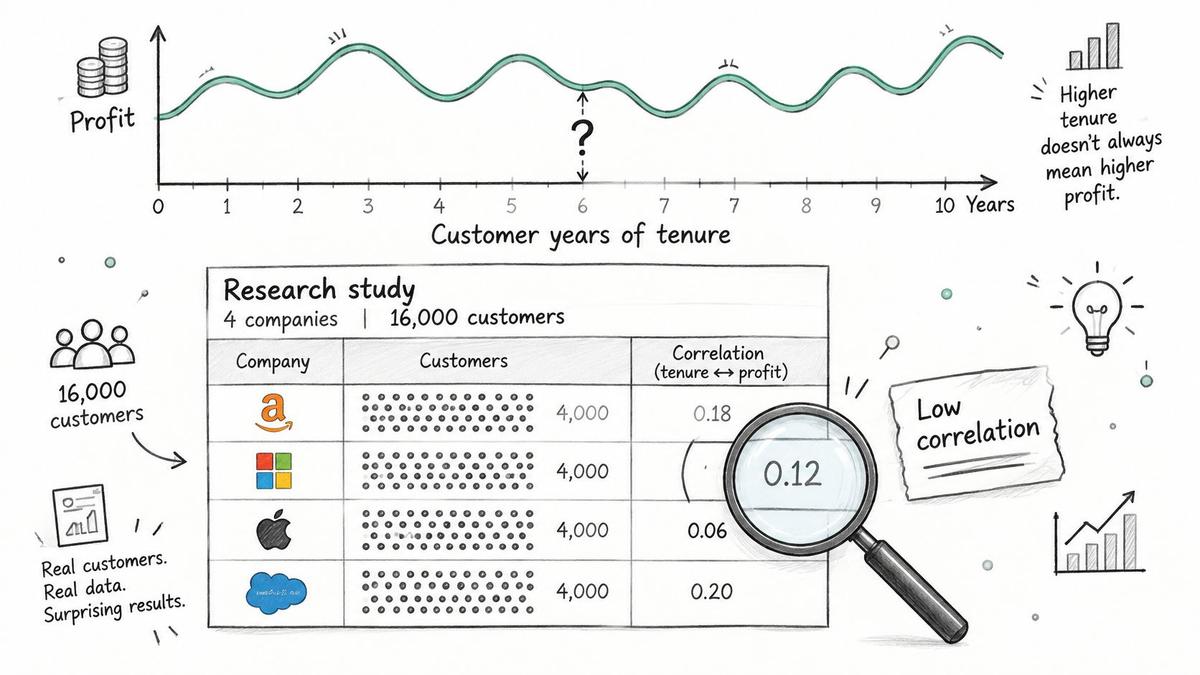
Tenure is the laziest proxy for value in ecommerce. Research summarized by Thematic on Reinartz and Kumar's customer profitability work covered four companies and more than 16,000 customers and found only weak-to-moderate correlations, between 0.20 and 0.45, between how long customers stayed and how profitable they were. Long relationships and profitable relationships overlap. They aren't the same set.
#Two Customers With the Same Loyalty Label
Customer A ordered six times over 18 months at $40 an order. That's $240 in revenue, but a quarter came back as returns, leaving $180. At a 50% gross margin, that's $90 of gross profit.
Customer B ordered three times over 12 months at $90 an order. That's $270 in revenue with no returns, and $135 of gross profit at the same margin.
B is the more valuable loyal customer, with half the orders and two-thirds of the tenure. Any dashboard that ranks customers by order count or months active puts A on top and steers the next campaign at the wrong person.
Run the calculation on your own cohorts. Take revenue, then deduct returns, discount value, shipping cost, payment fees and a fair share of service contacts. Sort cohorts by what's left, not by order count. Then test whether your loyalty initiatives move that figure: compare enrolled and unenrolled customers on 180-day contribution profit while controlling for first product, acquisition source and starting order value.
The rule that keeps you honest: when a campaign raises order count and lowers contribution profit per customer, it failed. The discount checks in the previous section are how you catch it before the quarter closes.
#Prioritize Your Next Loyalty Actions
Loyalty spending works best when it addresses the reason customers do not return. A rewards program added before you fix a weak second-purchase rate can subsidize orders customers would have placed anyway.
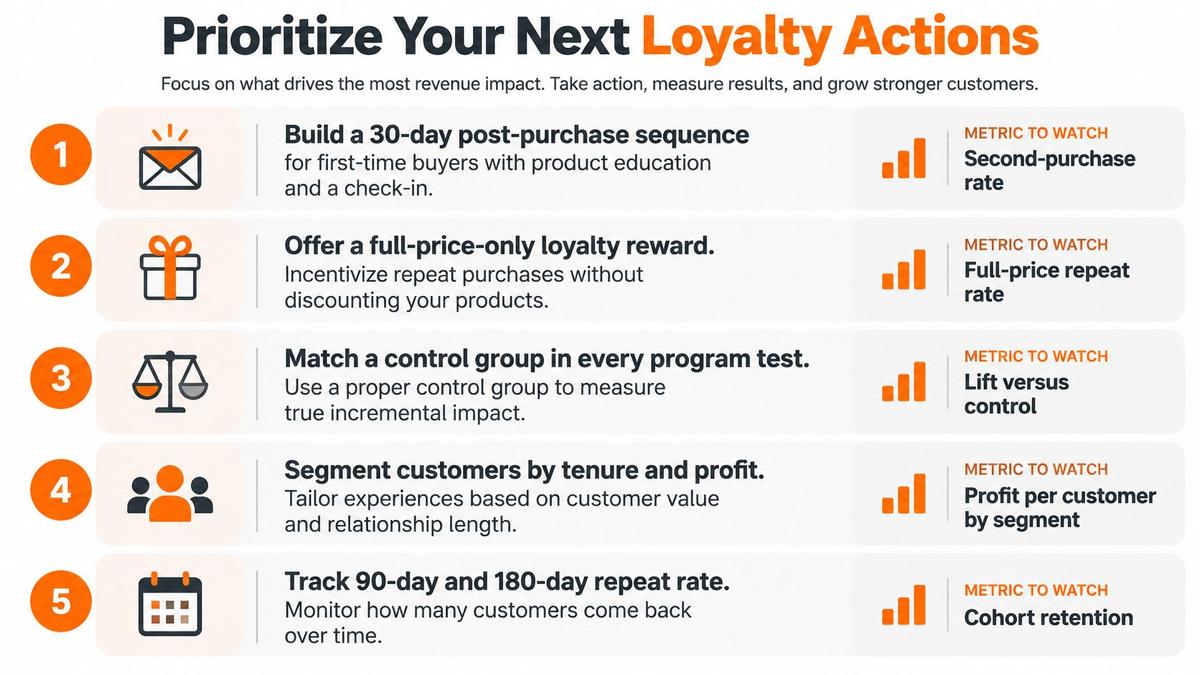
1. Build a 30-day post-purchase sequence for first-time buyers. Send product education, usage tips, and a replenishment reminder timed to your typical interval between orders. Track 90-day repeat purchase rate by cohort. A rising repeat rate is useful, but it does not prove that the messages caused the increase; compare cohorts exposed to the sequence with a suitable holdout.
2. Audit discounts on repeat orders. Calculate the share of repeat orders that use a discount code. If repeat buying is strong but full-price repeat is weak, reduce blanket offers to existing customers before adding another incentive. Otherwise, you may mistake discount dependence for preference.
3. Test win-back messages against a holdout. Identify customers who have passed their usual reorder interval, message one group, and leave the other untouched. Compare reorder rates after the test. Without a holdout, a return could reflect normal buying behavior rather than the campaign.
4. Test points or tiers against a control group. Only 38% of UK companies in a 2025 industry study reported tracking incrementality consistently, with data quality named as the leading measurement challenge by roughly 37%, according to the Medallia Ipsos loyalty report. Measure whether the program changes repeat buying, then weigh the added orders against the discount and operating costs.
Before funding a program, model a retention gain against your own economics. Bain's loyalty research is often summarized as a 5% retention gain producing 25% to 95% more profit. Its underlying examples came from service businesses: approximately 85% more profit for one bank branch system, 50% for an insurance brokerage, and 30% for an auto-service chain after reducing defections by 5%. Treat those results as context, not a forecast for your store. Model a 1-point or 5-point retention gain using your own figures, including discount, fulfillment, service, and payment costs. Revenue growth alone can make an unprofitable campaign look successful.
#How Often to Review
Check monthly if you buy traffic, or quarterly if your store is mostly organic. Paid acquisition can change the mix of customer cohorts quickly, so waiting a quarter may leave weak downstream performance unchecked. Organic cohorts tend to shift more slowly, making frequent model changes less useful.
Set one task for this week: calculate the 90-day repeat purchase rate for your three most recent cohorts and compare the trend with your category median. Then identify whether the next test should address repeat behavior, discount reliance, or the causal effect of a loyalty offer.
Brand loyalty measurement is more useful when it separates repeat behavior from the reason behind it. Arlo reads repeat purchase rate, cohort retention, and sales, traffic, and product signals from Shopify, then turns them into a weekly 20 Minute CMO report with action items ranked by dollar impact. Setup takes minutes through the Shopify App Store. The service includes a 14-day free trial, then costs $47 per month with no contracts. Visit Arlo to start.