Repeat Purchase Rate: A Shopify Founder's Guide
By Arthur Falcone · Founder of Arlo
Most founders check repeat purchase rate the way they check a weather app, one number, one feeling, one quick judgment. That's the wrong habit. A store can look “bad” on paper and still be healthy for its category, or it can look fine while leaking the exact customers who should be coming back.
The useful question isn't whether your number is high or low in isolation. It's whether your purchase cycle, category, and customer mix make that number meaningful, and whether the metric is pointing you toward the right fix. In practice, repeat purchase rate works less like a grade and more like a diagnostic readout, one that helps you spot when a store needs better post-purchase flows, better segmentation, or a better offer structure.
#Table of Contents
- Why Your Repeat Purchase Rate Is Probably Lying to You
- The Exact Formula and Shopify Calculation Method
- Repeat Purchase Rate Benchmarks by Vertical and Category
- Cohort Analysis and Customer Segmentation for Retention
- Diagnostic Checks and Prioritized Improvement Tactics
- Measuring Revenue Impact and ROI of Retention Efforts
- How Arlo Surfaces Repeat Purchase Signals and Prioritizes Actions
#Why Your Repeat Purchase Rate Is Probably Lying to You
A single repeat purchase rate number can mislead you fast if you ignore the window behind it. A 365-day lookback and a 90-day lookback are not the same metric, because the time frame materially changes who gets counted and who gets excluded VisionLabs. That's why founders who compare their store to a generic benchmark often end up celebrating the wrong thing or panicking for no reason.
#Category context changes the meaning
A 28.2% average repeat purchase rate is a useful baseline in broad ecommerce, but it doesn't mean every store should aim there Sender. Consumables naturally repurchase faster than durable goods, and industry guidance puts ranges around 35% to 45% for consumables, 30% to 40% for beauty and skincare, 25% to 32% for apparel, and 12% to 25% for home goods and electronics BSandCo. A lower number can be perfectly healthy when the product doesn't need to be bought often.
Practical rule: never compare a replenishment brand to a furniture brand without normalizing for purchase cycle and category.
The more useful read is this. If your category should naturally generate repeat behavior and your number is weak, the problem is probably not “loyalty” in the abstract. It may be product satisfaction, follow-up timing, or a post-purchase sequence that goes quiet too early.
#Window length can change the story
The metric is cohort-sensitive by design, not a vanity score. A 90-day result captures fast movers and replenishment behavior, while a 365-day result includes slower second purchases that would otherwise be invisible VisionLabs. Benchmarks can differ sharply because the window differs sharply, and that's why benchmark talk without a time frame is usually noise.
The practical takeaway is simple. Use the number to ask better questions. Which customers should have repurchased by now. Which product lines create habitual buying. Which cohorts are improving, and which ones are stalling.
#The Exact Formula and Shopify Calculation Method
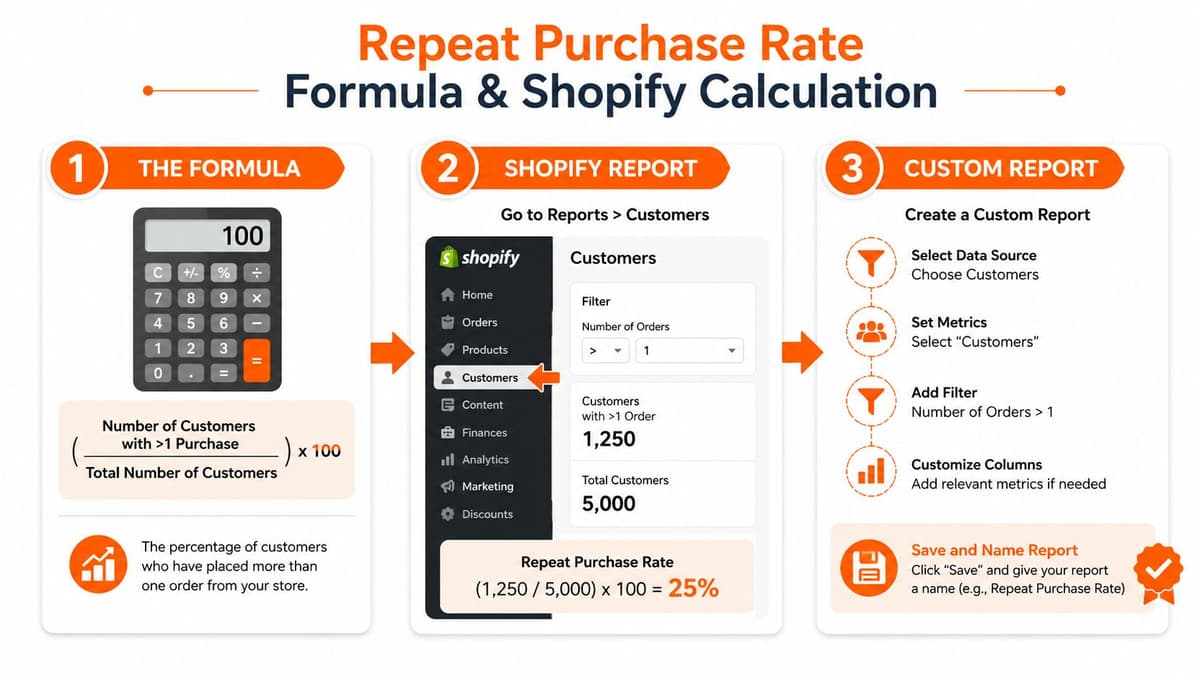
The cleanest formula is straightforward, repeat purchase rate = (number of customers with 2 or more orders / total unique customers) x 100 Rivo. The part most guides skip is the definition of unique customer and the need to specify the window every time you report the number. Without that, you end up mixing new buyers, old buyers, and inactive accounts into one blurry metric.
#Use the right Shopify view
In Shopify, start from customer-level order data, not revenue summaries. You want to identify customers who placed 2+ orders inside your chosen period, then divide by the total number of unique customers in that same period. If your reporting tool supports filters, save the view with the same time window every month so the number stays comparable.
For teams that want the logic spelled out cleanly, the broader retention framing in analytics for ecommerce is useful because it keeps the metric tied to decision-making rather than dashboard clutter. If you sell to fast-moving categories, the same view can help you spot whether buyers are returning on the schedule your product requires. For slower-moving brands, it keeps you from mistaking a long purchase cycle for weak retention.
#Match the window to the product
A consumables brand can use a shorter cycle window, because the second order should happen relatively quickly. A durable goods store should usually measure on a longer horizon, because the customer's natural repurchase cycle is slower. If you use the wrong window, you'll undercount healthy behavior or overstate weak behavior.
Use the business's expected repurchase cycle, not a calendar habit, as the measurement window.
That matters even more for brands that mix replenishment with occasional purchases, including a shop where discover small food and wellness brands might buy once for trial and return later for a routine restock. In that kind of catalog, one window rarely tells the whole story. A short window can show whether follow-up flows are working, while a longer one shows whether buyers are coming back after the first repeat.
#Three ways to calculate it without guessing
- 90-day window for consumables: count customers with 2+ orders in the last 90 days, divide by unique customers in that same 90-day set.
- 365-day window for durable goods: count customers with 2+ orders in the last 365 days, divide by unique customers in that period.
- Rolling 12-month cohort view: group buyers by first purchase month, then track how many return inside the next 12 months.
Those three views answer different questions. The short window tells you whether your post-purchase motion is working now. The long window tells you whether you're building a base of buyers who return over time. The cohort view tells you whether recent changes are improving retention for specific acquisition groups. If you want to see how these signals surface in a retention workflow, the operating model in analytics for ecommerce shows how to tie the number back to actions instead of treating it like a static dashboard line.
#Repeat Purchase Rate Benchmarks by Vertical and Category
Generic benchmarks can create false confidence. A 20% repeat purchase rate can look strong for a low-frequency, high-consideration product and weak for a replenishment brand that should see customers come back sooner. Benchmarking only works when the category, purchase cycle, and customer intent line up.
Use the category table as a starting point, not a verdict.
| Category | Typical Range | Purchase Cycle | Key Driver |
|---|---|---|---|
| Consumables | 35% to 45% | Frequent replenishment | Natural repurchase need |
| Beauty and skincare | 30% to 40% | Routine-based | Habit and product consistency |
| Apparel | 25% to 32% | Seasonal or occasion-driven | Style refresh and fit |
| Home goods | 12% to 25% | Longer cycle | Low repeat need |
| Electronics | 12% to 25% | Infrequent replacement | Durable product life |
Those ranges fit the broader ecommerce guidance that places repeat purchase rates around 25% to 30%, with Shopify-specific stores often clustering near 27% Sender. Another benchmark set puts the average ecommerce repeat purchase rate at 18.8% across 156,000 DTC customers BSandCo. The spread is not a contradiction. It reflects different merchant mixes, category mixes, and measurement windows, which is exactly why founders should resist treating one benchmark as universal.
For founders selling replenishable products, it also helps to discover small food and wellness brands and study how their customer journey is built around repeat behavior rather than a one-and-done checkout.
#How to choose the right benchmark
Start with the product's natural repurchase speed. Then weigh price point, whether customers usually buy multiples, and whether the product gets consumed, replaced, or collected. A durable goods brand can be healthy at a lower rate because repeat timing is slower, while a consumables brand should usually expect a much stronger result.
A good benchmark pushes action. If you are below your category range, check the customer journey and the purchase cycle by cohort. If you are inside the range, focus on order frequency, basket size, and which segments deserve more retention spend. The segmentation approach in customer segmentation for ecommerce is a useful reference if you need to turn that into a working workflow.
#Cohort Analysis and Customer Segmentation for Retention
The average repeat purchase rate hides the most useful part of the story. Two stores can land on the same number while having completely different customer behavior underneath it. One may be improving with newer cohorts. The other may be leaning on a small group of repeat-heavy buyers while everyone else disappears.
#Group by first purchase date
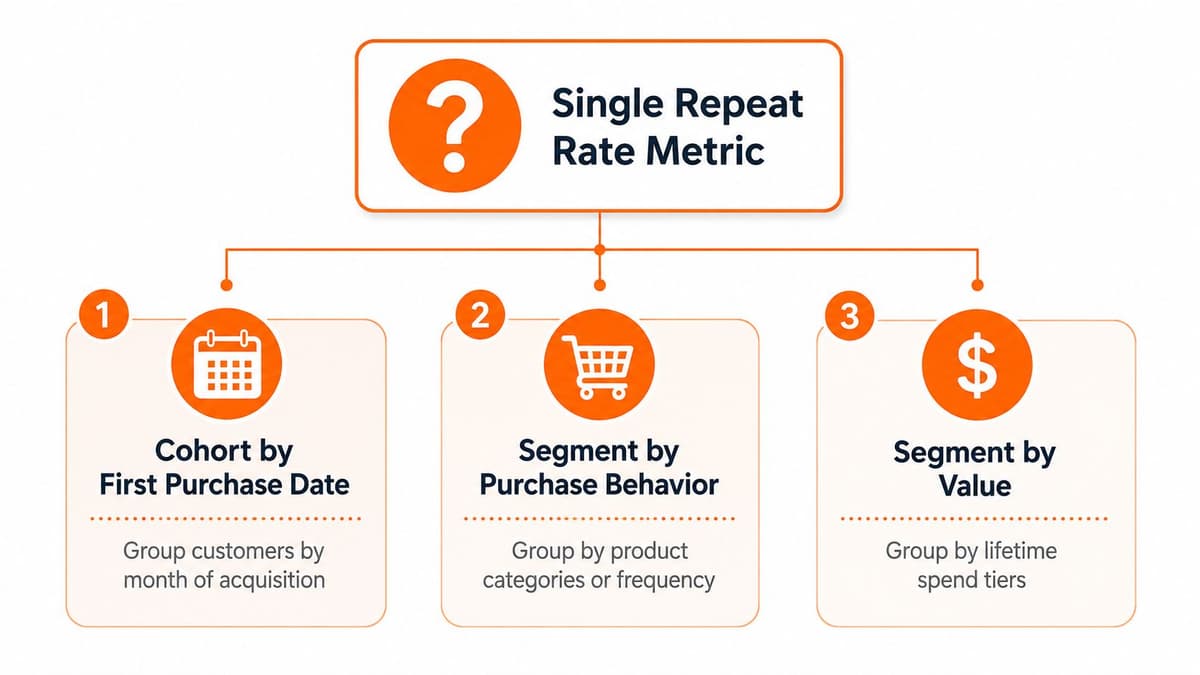
Cohorts tell you whether customers from a given month are repeating better than older customers. If January buyers and March buyers behave differently, that difference usually reflects something operational, a better post-purchase sequence, a cleaner product experience, or a stronger offer. That's the level where retention work becomes visible.
Use your email platform or analytics stack to group customers by first order month. Then compare repeat behavior across those cohorts instead of only staring at the overall rate. The segmentation example in customer segmentation for ecommerce is a useful reference point if you need to map this into an actual workflow.
#Identify customers who are at risk
An at-risk customer is someone who should probably have repurchased by now based on your product cycle but hasn't. That group matters because the timing is already off, so a generic batch campaign wastes attention. Customers who bought replenishable products need different treatment from customers who bought a one-time item.
#Use behavior and value together
A basic RFM approach works well here, recency, frequency, and monetary value. Recent, frequent, high-value buyers deserve the most protection. One-time buyers need different messaging, usually centered on use case, education, or a relevant second product, not the same incentive you'd send to a warm repeat customer.
- Cohort by first order: track whether recent acquisition months repeat more cleanly than older ones.
- Behavioral segment: split by what was bought, reorder likelihood, or category affinity.
- Value tier: protect high-spend customers with faster follow-up and tighter service.
A retention win is usually a timing problem before it's a discount problem.
The practical point is this. Win-back campaigns should follow purchase cycles, not arbitrary calendar windows. If you wait too long, the customer is no longer warm. If you start too early, you're just filling the inbox.
#Diagnostic Checks and Prioritized Improvement Tactics
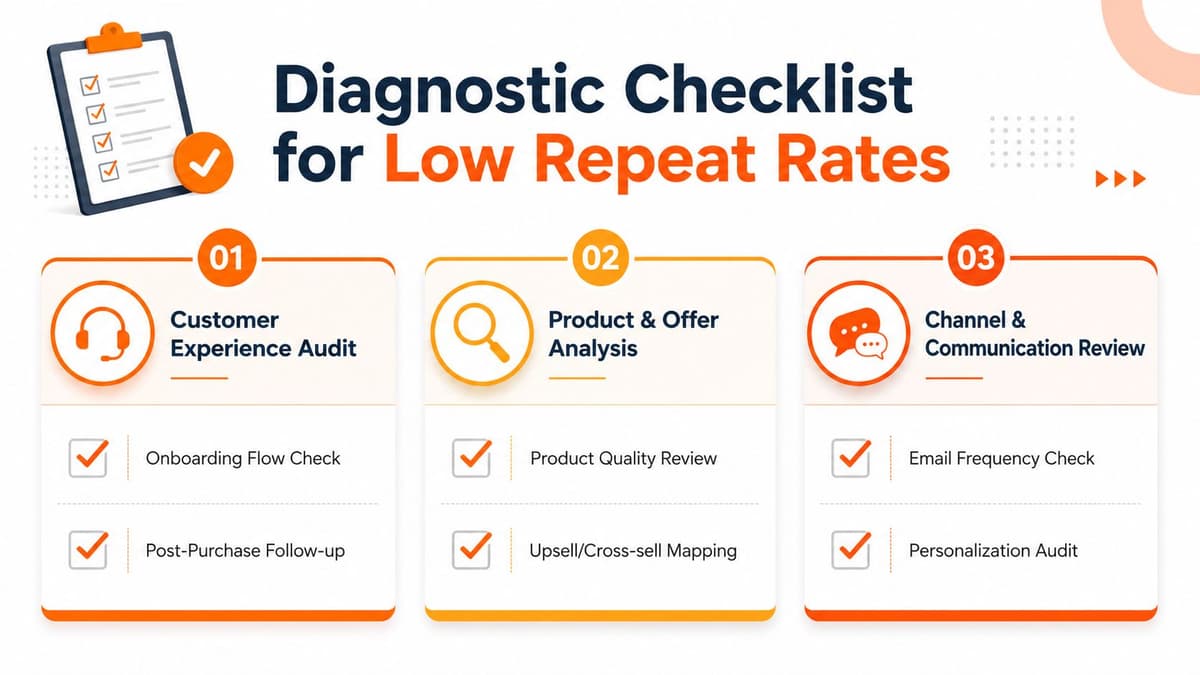
When repeat purchase rate lags, the fastest mistake is to buy a loyalty app and hope for a rescue. The better move is to diagnose where the second order is breaking down. A weak number can come from product disappointment, unclear post-purchase communication, poor offer design, or a simple mismatch between buying cycle and campaign timing.
#Start with the customer experience
Look at whether the first purchase lands well. Reviews, returns, and support tickets tell you whether the product experience is strong enough to support a second order. If customers are confused after delivery, the problem isn't retention software, it's onboarding and follow-up.
The practical fix is a tighter post-purchase sequence. Shipping confirmation, setup guidance, usage tips, and a relevant second offer work better than generic promo blasts because they meet the buyer at the point of need.
#Check the product and offer structure
Some stores underperform because the product doesn't lend itself to repeat buying, or because the first purchase doesn't naturally lead to a next one. If you sell a consumable, think about reminder timing and bundles. If you sell a durable item, think about accessories, complements, or replenishable add-ons.
One simple operational filter helps here. Identify which products already generate repeat orders, then push those products to existing customers instead of spreading retention energy across the whole catalog. That's the kind of prioritization recommended in practical ecommerce guidance from opensend.
#Review communication and timing
Many brands suppress recent buyers for too long. That creates a dead zone right after the first order, which is often exactly when the customer is most open to buying again. Re-engagement works best when it follows the actual repurchase cycle, not a guess.
If you need a structured way to evaluate campaign timing and performance, use the KPI framing in KPIs for ecommerce to keep the work tied to business outcomes, not just open rates or clicks.
#Prioritize by effort and impact
- Low effort, high impact: fix broken post-purchase emails and add product-use guidance.
- Medium effort, high impact: build cohorts and launch cycle-based win-back flows.
- Higher effort, selective use: loyalty, subscriptions, and deeper segmentation.
Don't start with the tactic you like. Start with the bottleneck that is actually suppressing the second order.
That order of operations keeps you from overcorrecting. You're not trying to “do retention.” You're trying to remove the specific friction that keeps customers from coming back.
#Measuring Revenue Impact and ROI of Retention Efforts
A better repeat purchase rate only matters if it changes the economics of the business. If you improve the metric but spend too much to do it, you've made the dashboard look nicer without improving profit. The right question is how much incremental revenue each retention effort creates relative to its cost.
A practical starting point is customer lifetime value, because repeat behavior usually lifts the total value of the customer, not just the next order. The earlier section on broader ecommerce KPI structure connects well to this, and the retention math belongs in the same decision stack as CAC, AOV, and payback.
#Tie tactics to dollar outcomes
Different tactics deserve different expectations. Email campaigns are cheap to run but need strong targeting. Loyalty programs and subscription incentives can lift retention, but they also introduce cost and operational complexity. The comparison only works when you measure revenue generated by repeat orders against the cost of the program.
If you want a budgeting lens, the ROI framing in how to calculate marketing ROI is a good companion because it keeps the analysis grounded in return, not activity.
#Track repeat customer revenue separately
Repeat customers don't just matter because they buy again. They often account for a disproportionate share of revenue in categories where replenishment is natural. That's why you should track repeat customer revenue as its own line, not bury it inside total sales.
A clean model includes these pieces.
- Cost of the tactic: software, discounts, labor, and creative time.
- Incremental repeat revenue: the extra orders that happen because of the tactic.
- Payback timing: how fast the tactic covers its cost.
- Segment-level return: which buyers are worth retaining first.
#Use lift analysis carefully
Not every improvement should be credited to one campaign. A cleaner first step is to compare cohorts before and after a change, then see whether repeat behavior improved in the expected window. That gives you a better read than chasing every conversion with the same attribution lens.
If the tactic doesn't change revenue, it's a workflow. If it changes revenue and survives cost, it's an investment.
The metric is only useful when it shapes budget. Once you can see the revenue effect by segment, you can stop spending equally on every customer and start backing the buyers who return.
#How Arlo Surfaces Repeat Purchase Signals and Prioritizes Actions
Most founders don't have time to rebuild cohorts every week or hunt through reports to understand why repeat behavior changed. That's where a tool like Arlo fits into the retention workflow, it reads the Shopify data, identifies what changed, and ranks actions by urgency and likely revenue impact. The point isn't more charts. It's fewer decisions left to guesswork.
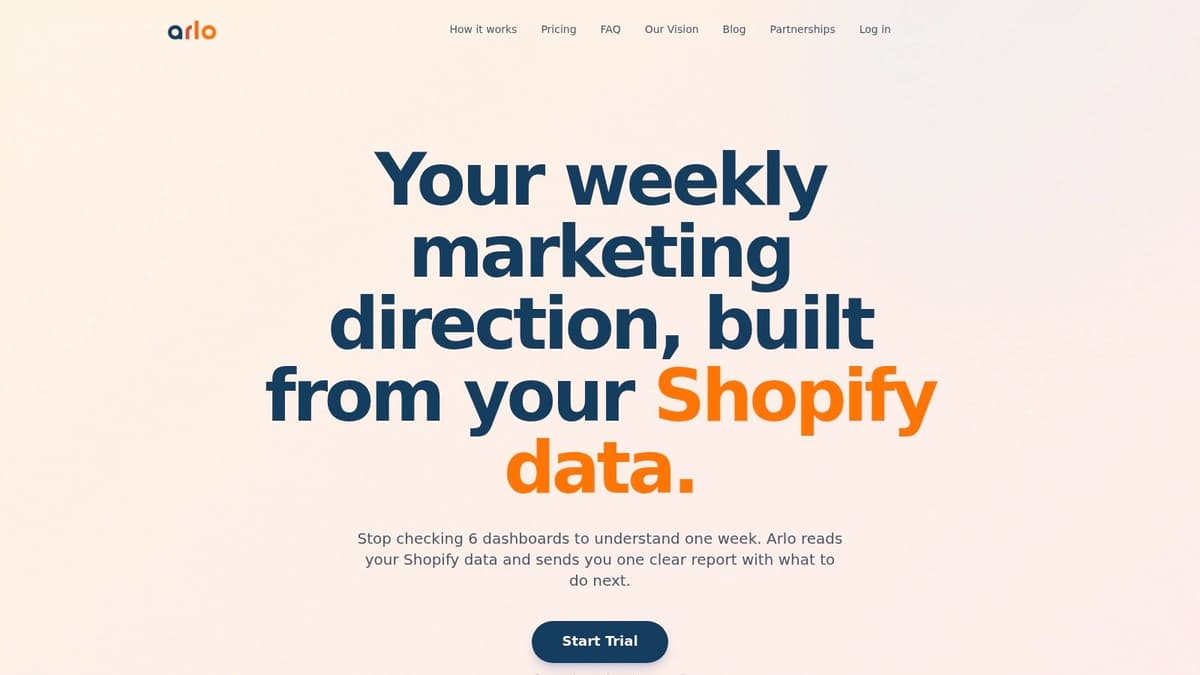
Arlo's weekly 20 Minute CMO report is built for that exact gap. It summarizes the store in plain language, then points to the retention signals that matter, which cohorts are slowing down, where repeat order timing is drifting, and what should happen next in the email flow or win-back sequence. It's the kind of automation that saves a founder from turning retention into a spreadsheet project.
The setup is straightforward through the Shopify App Store, and the output is designed for quick review, a one-page summary plus a short audio brief. That format matters because repeat purchase rate is only useful if someone acts on it, not if it sits in a dashboard until the month is over.
Here's the practical value. Instead of manually checking whether a segment is at risk, you can use the report to see which customer groups need attention first and what likely fix deserves the most effort. For founder-led brands that don't want to hire a full-time analyst, that makes retention work easier to maintain.
Later in the workflow, the report can help you compare options, whether the issue is a broken post-purchase flow, a win-back campaign aimed at a specific cohort, or a subscription offer that needs adjustment. If you're trying to turn repeat purchase rate into an operating signal instead of a vanity metric, that kind of prioritization is the point.
If you want a cleaner read on your retention engine, install Arlo and let it turn Shopify data into the specific next moves that affect repeat buying. It's built to surface what changed, why it matters, and which retention actions deserve attention first.