Definition of Customer Engagement: Metrics and Revenue
By Arthur Falcone · Founder of Arlo
Your dashboard shows healthy email opens, three new reviews and a customer tagging your store in a story. Yet the order count is flat. That gap between visible activity and sales is a reason to examine what engagement means for your business.
Customer engagement describes how customers think about, feel about and act toward a brand. Purchases show that a transaction happened; other signals, such as reviews or recommendations, show activity around the brand. Neither category alone proves a customer will buy again.
Use engagement as a diagnostic tool, not a feel-good scoreboard. If activity rises while orders stay flat, treat that as a warning to investigate. Ask which signals are growing, whether they lead to orders, and what decision each one should trigger.
#Table of Contents
- Customer Engagement Defined and the Metrics That Track It
- Thinking, Feeling and Doing
- How Engagement Turns Into Repeat Revenue
- Where Engagement Breaks and How to Diagnose It
- How Much Personalization Builds Trust
- Build an Engagement Scorecard and a Monday Plan
#Customer Engagement Defined and the Metrics That Track It
Strip the jargon and the question is threefold. Does the customer think about you, feel something toward you, and act on that feeling in ways a receipt never captures?
Picture a coffee shop. The regular knows the barista's name, tells a coworker the cold brew is worth the detour, and comes back on Tuesdays. A tourist buys one flat white and never returns. Both are customers. Only one is engaged.
Marketing scholarship draws the same line. Van Doorn and colleagues defined engagement in 2010 as customer actions directed at a brand that go beyond purchasing, including recommendations, word-of-mouth, reviews, blogging and participation in brand communities, as the Journal of the Academy of Marketing Science review of engagement research sets out. Purchases are revenue. Engagement is the voluntary activity around them that makes the next purchase likelier.
Core engagement metrics and what each one proves
| Metric | How to calculate | What it shows | Main limit |
|---|---|---|---|
| Views | Pageviews or email opens per visitor or recipient | Attention earned | Says nothing about whether the visitor cared |
| Clicks | Clicks divided by impressions, times 100 (click-through rate) | Interest in a specific offer | Curiosity clicks look the same as buying intent |
| Time engaged | Average engaged time per session | Depth of consideration | Long sessions can also mean confusion |
| Repeat purchase rate | Repeat customers divided by total customers, times 100 | Commercial loyalty | Replenishment or discounts can mask real attachment |
| NPS | Percentage of promoters minus the percentage of detractors on a 0 to 10 scale | Likelihood to recommend | Survey-based, so response bias is common |
Two of those deserve plain words. Repeat purchase rate is repeat customers divided by total customers, multiplied by 100, so a store with 400 repeat buyers out of 1,600 customers sits at 25%. NPS subtracts the share of customers scoring you 0 to 6 from the share scoring 9 or 10, which means one unhappy cohort can drag a cheerful average down.
No single number proves engagement. A click can be curiosity, and a repeat order can be a refill reminder or a discount code. Executives feel the same fog: 83% of surveyed executives said they need better tools to determine what drives purchases, and traditional measures such as CSAT and NPS don't reliably connect experience to loyalty or revenue, according to research on why engagement metrics miss purchase drivers.
So pick one metric from each layer (attention, feeling, action), track all three weekly, and let the definition become a number on a screen rather than a paragraph in a strategy doc.
#Thinking, Feeling and Doing
Engagement happens on three levels, and a customer can be far along one while stalled on another.
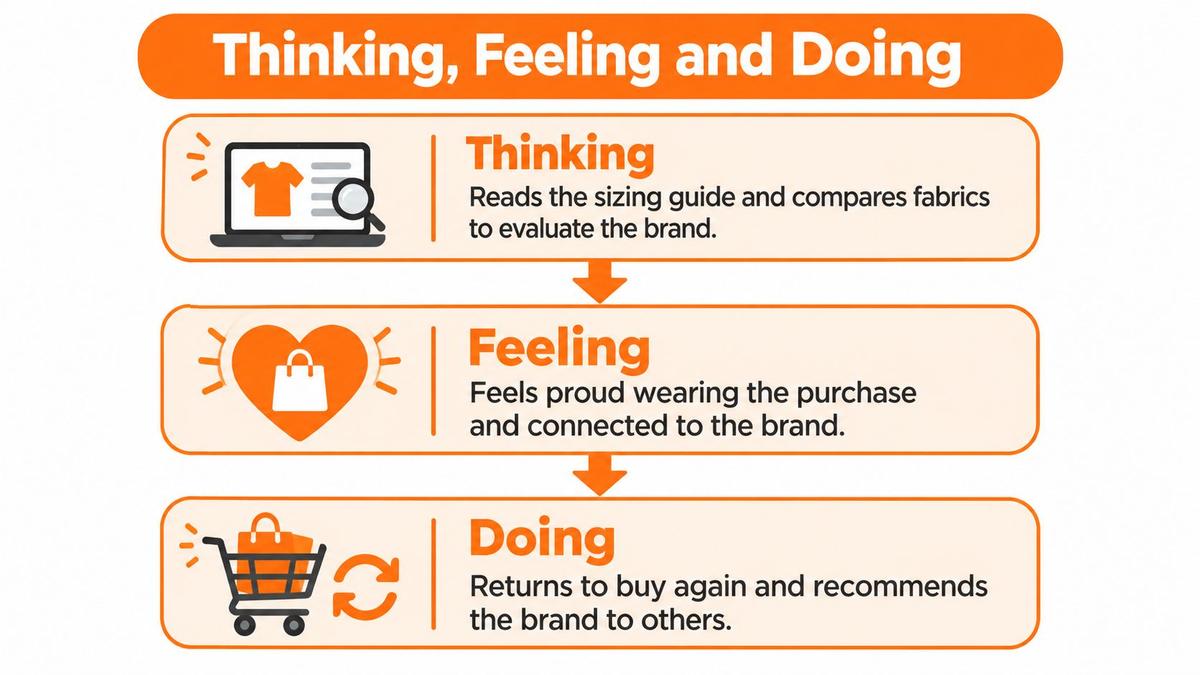
A shopper reading the sizing guide, comparing fabric weights and opening the same product page for the third time is thinking about the brand. Cognitive engagement is attention, learning and perceived relevance. Take that same shopper after she buys: she wears the jacket to work, feels a flicker of pride when someone compliments it, and forwards the link to a friend. That's feeling, the emotional layer of enthusiasm and attachment. Then she leaves a review after delivery, uses a referral code, or replies to your restock email. That's doing, the visible layer.
The three-dimensional model comes from Hollebeek's 2011 formulation, which described engagement as the level of a customer's cognitive, emotional and behavioral activity in specific brand interactions, as the engagement research review in the Australasian Marketing Journal explains. Brodie and colleagues added that these interactions are co-creative, meaning the customer helps shape the value rather than just receiving a product or a message.
The three engagement layers in a DTC store
| Layer | What it captures | Signals to track | Typical weak point |
|---|---|---|---|
| Cognitive | Attention, learning and perceived relevance | Product-page depth, repeat visits, time spent on guides | Visitors browse but never understand the difference |
| Emotional | Enthusiasm, attachment and pride | Sentiment in reviews, brand-search growth, unprompted mentions | Product is useful but feels forgettable |
| Behavioral | Visible actions and participation | Reviews, referrals, email replies, repeat orders | Action happens only when a discount is attached |
This is why purchase behavior alone tells you so little. Someone can buy four times a year out of habit and feel nothing about the brand. Someone else can read every guide you publish and still be deciding.
Pull your own data and pick one signal per layer. Product-page depth for thinking, review sentiment for feeling, referrals for doing. Whichever one you can't find in your reports is the one to instrument first.
#How Engagement Turns Into Repeat Revenue
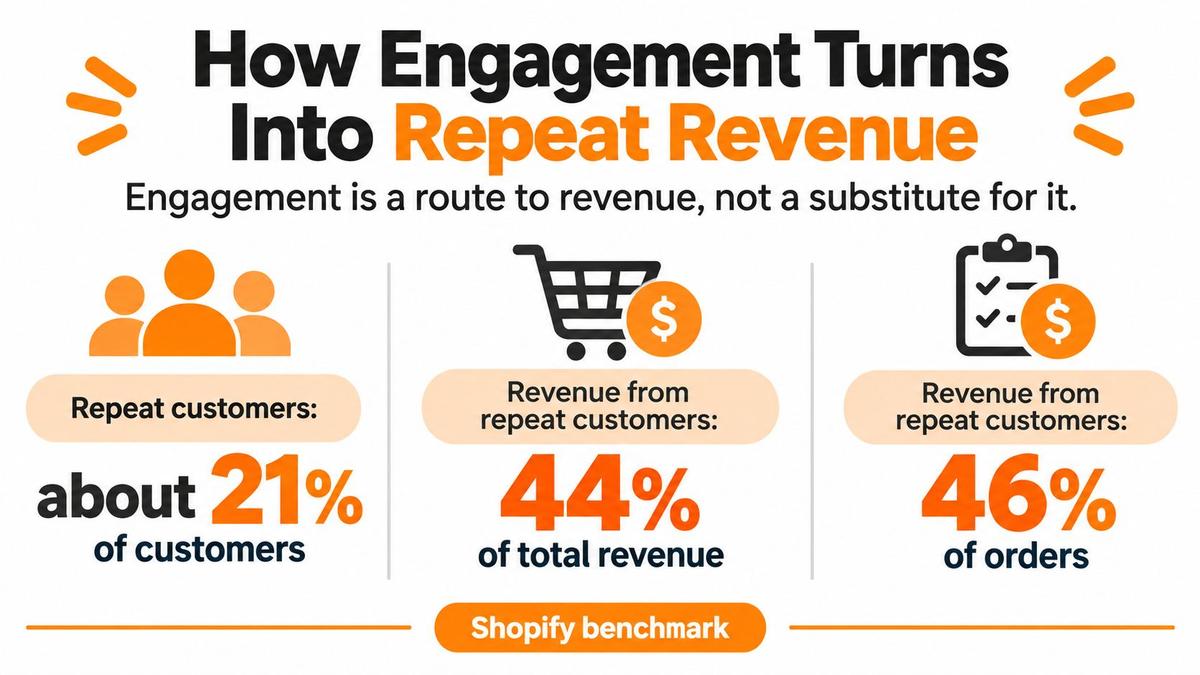
Engagement is a route to revenue, not a replacement for it, and the route is short enough to measure. Shopify's customer retention benchmarks report that repeat customers represent about 21% of customers but generate 44% of total revenue and 46% of all orders, and that once a customer buys twice they're 95% more likely to buy again. The second-order moment is the inflection point worth designing for, not a loyalty badge handed out at month six.
The link between the two isn't wishful thinking. An ecommerce study of 326 respondents reported a statistically significant positive relationship between overall customer engagement and customer retention, with a Spearman's rho of 0.624 and p below 0.001, as the study of email marketing, engagement and retention sets out. That's correlation rather than proof of cause, which is exactly why you test it in your own store.
Two stores show the pattern running in opposite directions.
- Skincare, signals converging: a first-time buyer opens three emails over two weeks, reads the routine guide, leaves a review on day 20 and reorders on day 45. Attention, affection and action all arrived before the second order, so the reorder looked predictable in hindsight.
- Pet food, early warning: a subscriber replies to an email about portion sizes in week 3, then stops reordering at week 8. Nobody flagged it because the order history looked normal for six weeks. The engagement drop came first, and it was the warning, not the aftermath.
To tie a signal to revenue, split customers into those who showed it and those who didn't, then compare time to second order and revenue per customer over the same window. If your repeat purchase rate hasn't moved alongside the signal, you've found activity rather than engagement. For retention plays that don't depend on new traffic, this guide to improving repeat business without more leads is worth working through.
#Where Engagement Breaks and How to Diagnose It
Two mismatches cause most of the confusion. Engagement looks healthy while orders fall. Or orders hold while engagement fades underneath them. Neither is fixed by sending more email.
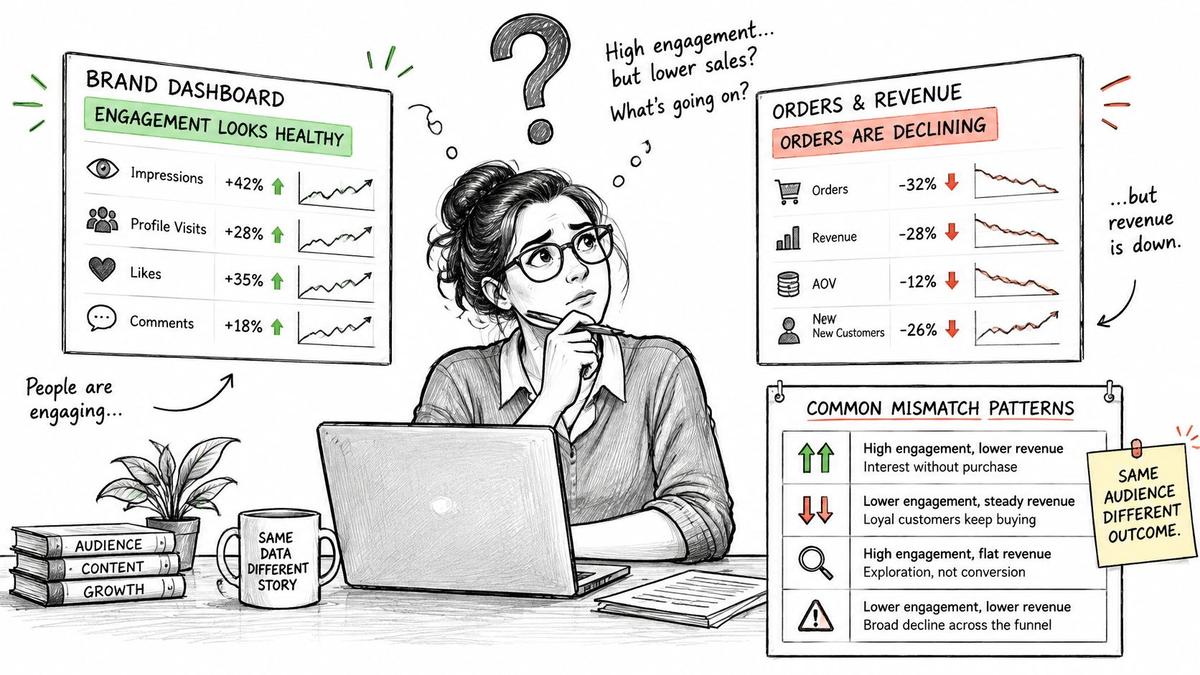
Split the problem before you solve it. Engagement is an investment of attention, feeling and action in specific interactions with a brand, and each dimension fails differently, which is why the engagement research in Psychology & Marketing argues for reading the dimensions separately rather than as one blended score. A blended score hides which part broke.
Engagement failure patterns and first checks
| Symptom | Likely cause | First check (under 1 hour) | Fix to test over 2 weeks |
|---|---|---|---|
| Attention falling, sentiment stable | Discoverability or merchandising | Search terms, collection-page order, ad creative | Reorder collections or rewrite ad hooks against the prior baseline |
| Attention stable, sentiment falling | Value, trust or experience | Review scores, delivery times, product photos, return reasons | Fix the weakest of these and track sentiment weekly |
| Strong sentiment, weak action | Friction | Mobile checkout test, out-of-stock messages, first post-purchase email timing | Remove the single worst step and compare conversion to baseline |
| High email clicks, no orders | Failing offer or landing page | Click-to-landing path and offer terms | Test one landing page or offer change against current conversion |
Take the fourth pattern seriously, because it's the one most often blamed on the audience. High clicks with no orders usually means the list is fine and the offer or landing page is not. Run every test against a baseline from the prior period rather than against a feeling, and use a two-week window so you're not mistaking a seasonal wobble for a trend.
Here's the same mismatch in video form.
Diagnostic rule: if you can't name the failing layer in one sentence, you don't have a diagnosis yet, and no budget should move until you do.
#How Much Personalization Builds Trust
The reflex when engagement dips is to send more. Another segment, another abandoned-cart flow, another AI-written subject line. More personalization doesn't automatically produce stronger engagement, and past a certain point it produces the opposite.
Customers will trade data for smoothness, within limits. PwC's 2025 survey, cited in the 2025 study of engagement, personalization and privacy, found that 53% of consumers considered personal-data sharing worthwhile when it made interactions smoother, while 93% said mishandling that data would cause a brand to lose their trust. MoEngage's 2024 Customer Engagement Benchmarks Report, built on more than 20 billion data points, found 67% of consumers comfortable with brands using their data to provide more personalized experiences. Comfortable isn't the same as careless.
Three rules keep relevance from sliding into surveillance.
- Disclose the machine. If a recommendation, a chat reply or an email was written by AI, say so plainly. Customers forgive automation. They don't forgive discovering it later.
- Segment on aggregates, personalize on purchases. Broad groups can be built from anonymised patterns. Keep individual-level detail for moments a customer clearly expects, such as a replenishment reminder for something they bought.
- Honor withdrawal within a day. A customer who unsubscribes and still receives a "sorry to see you go" sequence has learned something about how you treat consent.
Measure the trust side alongside clicks: unsubscribe rate, spam complaints, support tickets that mention privacy, and whether return visits hold up in the week after a personalized send. If clicks rise while those four worsen, you bought engagement with trust.
If a customer would be surprised to learn how their data was used, that personalization is too far. Scale it back before you scale it up.
For a concrete way to build segments from behavior rather than guesswork, this customer segmentation example walks through the grouping logic. Smaller merchants face the same trade-off with fewer hands, so start with fewer, obviously relevant touchpoints and expand only when unsubscribe and complaint rates stay flat.
#Build an Engagement Scorecard and a Monday Plan
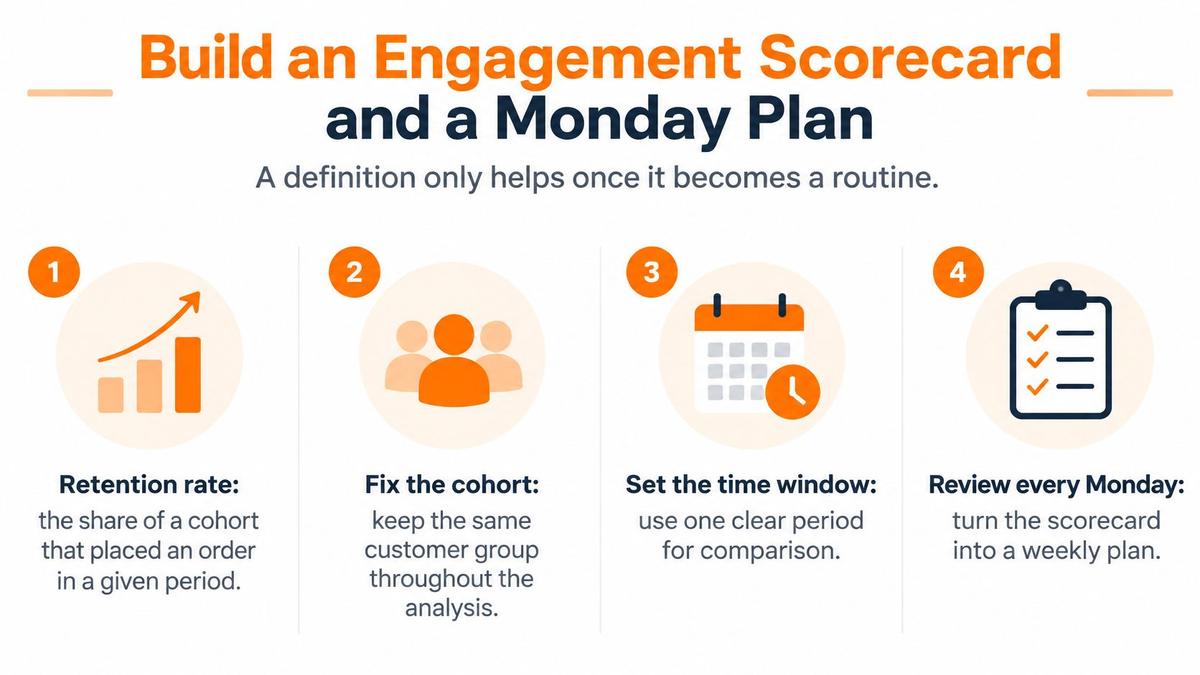
A definition only helps once it becomes a routine, and the routine starts with one number everyone agrees on, measured the same way every week.
Retention is usually that number. Shopify's analytics field reference defines customer retention rate as the percentage of customers in a given cohort who placed an order during a specified period, which means the cohort and the time window have to be fixed before anyone reads the result. The same reference lists the formula operators reach for most: repeat purchase rate = number of repeat customers divided by total customers, multiplied by 100.
#Six Steps From Definition to Scorecard
- Choose one engagement action per layer. An email reply for doing, product-page depth for thinking, review sentiment for feeling. One each keeps the report readable and the causes separable.
- Pair each action with a commercial outcome. Repeat purchase rate, retention rate, average order value and revenue per customer. An action with no outcome attached is a hobby.
- Group customers by first-order month. Cohorts of the same age stay comparable, so a strong January doesn't flatter a weak March.
- Record a baseline before any campaign starts. Otherwise a discount takes credit for a lift that began two weeks earlier.
- Set an action threshold in advance. When a cohort's repeat rate falls below its prior baseline, a win-back test triggers. No debate, no extra meeting.
- Review weekly and change one thing at a time. Three simultaneous changes teach you nothing about which one worked.
The warning sign: rising email clicks or review volume with flat or falling orders. Activity is climbing faster than value, and that's the pattern most often celebrated in a Monday report.
#Your First Monday
Pull the last 90 days of Shopify orders and build cohorts with time to second order. Choose five metrics and give each one a current value, a target and the action it triggers. Book 20 minutes at the same time each week, and end every session with a written decision list, even if the decision is to wait another week.
A weekly report built from your Shopify data, such as the 20 Minute CMO, covers what changed, why it matters and what to do next, so the meeting is about decisions rather than exports. This guide to ecommerce analytics covers which numbers deserve a place on the page at all.
The first task this week is small. Build the cohorts, choose the five metrics, set one threshold. Then name the single number you want to move first, and for most founder-led stores that's the share of first-time buyers who place a second order.
Arlo builds a weekly marketing analyst for Shopify merchants: the 20 Minute CMO report reads your sales, traffic, customer and product data and ranks the actions worth taking, with the revenue at stake attached to each one. If the engagement signals in this article are still scattered across three dashboards, that's the gap it closes, delivered as a one-page summary and a five-minute audio brief. Start a 14-day free trial at Arlo and your first report arrives minutes after you connect your store.