
Ecommerce Reporting Software: A Founder's Guide
By Arthur Falcone · Founder of Arlo
Monday morning starts with four tabs and four answers. Shopify shows one revenue number, Meta Ads Manager claims another, Klaviyo reports email-attributed sales, and Google Analytics gives you a different view of the funnel. You know the store had a good or bad week, but you can't tell which number finance will accept, which channel created profitable demand, or what deserves attention before Friday.
That's the core problem ecommerce reporting software should solve. It shouldn't give you another collection of attractive charts. It should join store orders, marketing costs, customer behavior, retention, and operational signals into a consistent decision layer. The category has grown from basic dashboarding into a meaningful commerce infrastructure market, with the global e-commerce analytics software market estimated at USD 3.5 billion in 2024 and projected to reach USD 12.5 billion by 2033, according to Verified Market Reports' e-commerce analytics software market analysis.
For a founder-led DTC brand, the useful output isn't “revenue was down.” It's “mobile checkout completion weakened, paid spend rose on a campaign attracting first-time buyers, and the product most often purchased by repeat customers went out of stock.” That level of interpretation turns reporting into an operating habit.
#Table of Contents
- Why Ecommerce Reporting Software Matters for DTC Founders
- The Five Metrics That Actually Drive Ecommerce Decisions
- The Data Trust Gap Most Dashboards Ignore
- Real Shopify DTC Workflows and Reporting Cadences
- Buyer's Checklist and ROI Evaluation Framework
- Integration and Setup Considerations for Shopify Stores
- How AI-Powered Weekly Reports Close the Reporting Gap
#Why Ecommerce Reporting Software Matters for DTC Founders
A founder I've worked with once spent most of a Monday morning reconciling channel dashboards before making a single decision. Shopify showed actual orders, Meta showed attributed conversions, Klaviyo showed email revenue, and Google Analytics showed sessions and conversion behavior. None of the platforms was necessarily broken. They were answering different questions with different attribution rules.
That distinction matters. A platform-native dashboard is designed to demonstrate the value of its own channel. Meta reports Meta-attributed results. Klaviyo reports revenue connected to its messages. Shopify records orders in the storefront. Ecommerce reporting software has to sit above those views and establish how they relate.
The most useful reporting layer combines first-party orders, ad spend, retention data, refunds, and customer status. Expert guidance recommends comparing channel-reported performance with blended measures such as MER, new-customer CAC, and contribution margin, because platform attribution can double-count conversions across channels. The ecommerce analytics guide for CPG brands is useful background for teams thinking about measurement across products, channels, and customer behavior rather than looking only at top-line sales.
#From dashboards to decisions
A reporting tool earns its place when it answers a question quickly:
- What changed? Revenue, orders, conversion, spend, retention, product mix, or fulfillment performance.
- Why did it change? Traffic quality, checkout friction, stock availability, campaign mix, device behavior, or customer composition.
- What should happen next? Pause wasteful spend, fix a broken flow, adjust merchandising, investigate an inventory mismatch, or protect a channel that is working.
The market's expansion reflects a broader shift in how digital commerce teams use analytics. One forecast estimates the global e-commerce software market at USD 11.25 billion in 2025, projected to reach USD 44.32 billion by 2034, while another report estimates the broader e-commerce analytics market at USD 28.64 billion in 2026 and USD 84.69 billion by 2035. These projections from Fortune Business Insights' e-commerce software market coverage point to a category becoming core infrastructure, not an optional reporting add-on.
#The founder's actual advantage
Small DTC teams don't need every possible metric. They need a short list of trusted measures connected to decisions. A useful report compresses raw store data into priorities, makes the calculation rules visible, and gives finance and marketing the same answer when they ask about revenue or customer acquisition.
More data won't fix an unclear operating rhythm. A shared definition of revenue, customer, conversion, and profitability will.
#The Five Metrics That Actually Drive Ecommerce Decisions
The right metrics aren't the ones that fill the most dashboard space. They're the ones that change what you do with inventory, creative, pricing, spend, and retention.
#Customer lifetime value
LTV becomes useful when it's tied to acquisition cohorts, product entry points, and payback timing. In Shopify, compare customers acquired during a defined period with the revenue they generate in later purchase windows. A reporting system should separate first-time and returning customers instead of treating all revenue as equivalent.
If customers acquired through a discount-heavy campaign place one order and customers acquired through an educational product page return more often, aggregate ROAS hides the difference. The decision may be to reduce the apparent winner's budget and invest in the channel or product combination that produces stronger customer value.
#Average order value
AOV is more than a scoreboard number. It tells you whether bundles, merchandising, pricing, and post-purchase offers are increasing the value of each completed order.
A Shopify operator might see stable order volume but weaker revenue. AOV can reveal that customers are buying fewer units, choosing lower-priced products, or abandoning a bundle offer. The next action could be a product-bundle test, a cart recommendation, or a review of discount logic. AOV is commonly appropriate for a weekly review, because daily fluctuations can create noise. Industry dashboard guidance places AOV in the weekly cadence alongside return rate, as outlined in this ecommerce KPI dashboard guide.
#Conversion funnels
Conversion reporting should locate the leak, not just announce the final rate. Shopify defines checkout conversion rate as sessions that completed checkout divided by sessions that reached checkout, as documented in Shopify's analytics fields reference.
That definition makes the metric actionable. If sessions reaching checkout remain steady while completed checkouts fall, inspect payment errors, shipping surprises, discount behavior, and mobile usability. If product-page engagement weakens before checkout, the problem may sit in traffic quality, merchandising, or offer clarity instead.
#Cohort retention
Aggregate repeat purchase rate can improve while newer cohorts get worse, or remain flat while an older high-value cohort keeps the total healthy. Cohort retention assigns customers to their acquisition period and tracks subsequent behavior, so you can distinguish a temporary reporting mix shift from a real retention problem.
Use it to compare customers acquired through a campaign, product, or offer. A channel may look unprofitable in a short window because customers purchase later. Cohort-aware ROAS helps show when a channel breaks even and whether delayed payback is consistent with customer value, a distinction highlighted in AttributionApp's B2C attribution guidance.
#Channel attribution
Attribution should help allocate resources, not reward whichever platform claims the order. Compare channel reporting against MER, new-customer CAC, contribution margin, and blended Shopify revenue. Then check whether the result survives customer-level and cohort-level analysis.
A practical reporting layer should show first-time customers separately from returning customers, remove duplicate purchase records, and connect spend to the period in which revenue and margin are realized. For more background on how to structure an analytics in ecommerce framework, focus on the decision attached to each metric. Daily checks should emphasize conversion and abandonment, weekly reviews should examine AOV and returns, and monthly analysis should evaluate repeat purchase behavior.
#The Data Trust Gap Most Dashboards Ignore
Better charts don't solve contradictory source data. They make the contradictions easier to circulate.
Marketing may define revenue as platform-attributed sales. Finance may use net sales after refunds, discounts, and adjustments. Operations may work from fulfilled orders. Without shared ownership and definitions, each team can produce a technically correct report that gives a different answer to the same business question.
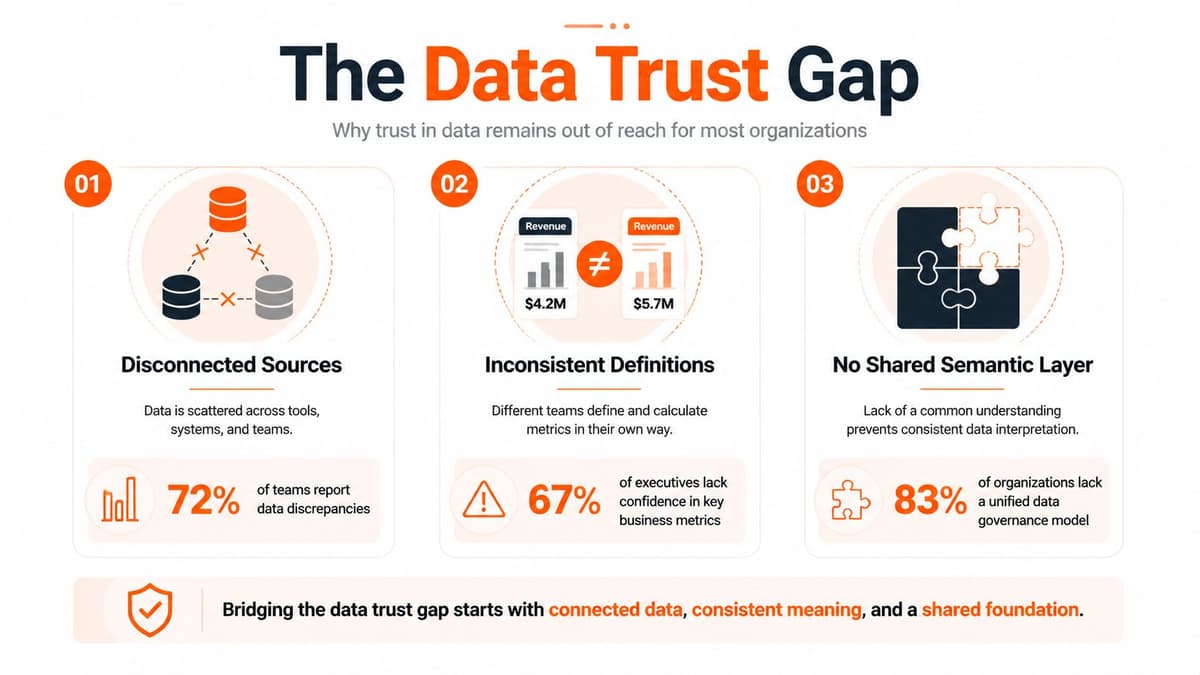
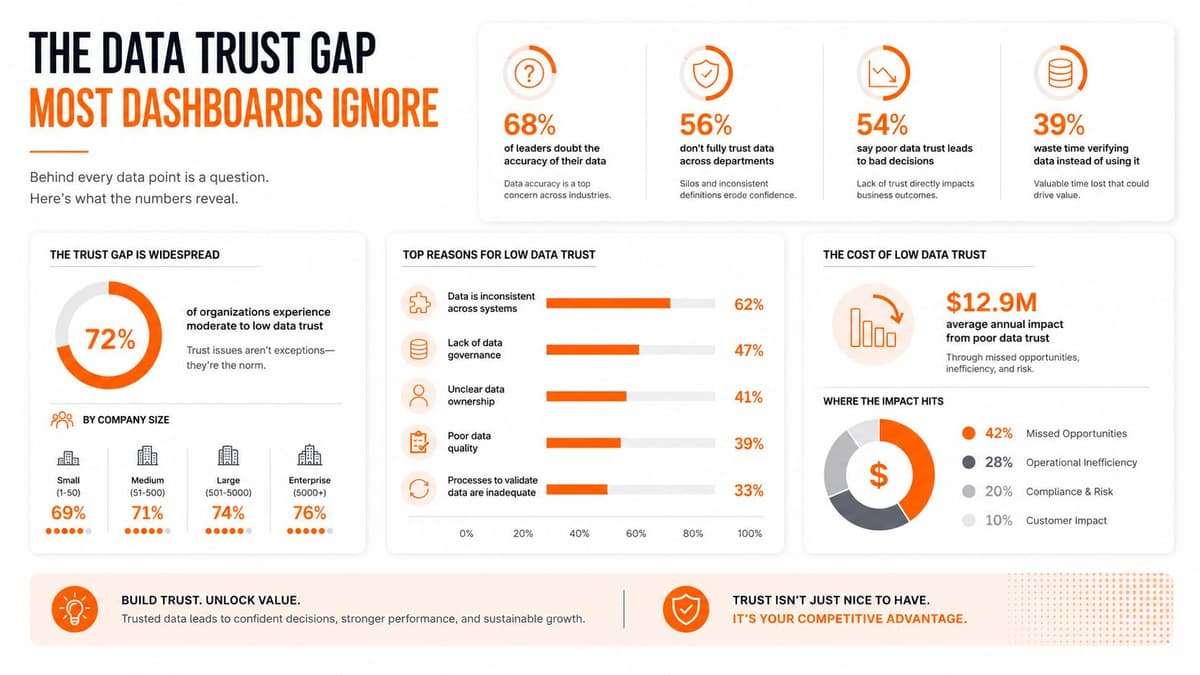
Neutral coverage identifies three recurring causes: disconnected sources, inconsistent metric definitions, and no shared semantic layer. The problem is material. 64% of organizations cited poor data quality as their top integrity challenge in 2025, according to Saras Analytics' coverage of ecommerce reporting tools. Another study cited in the same coverage found 58% of leaders said key decisions are often based on inaccurate or inconsistent data.
#Metric ownership comes before visualization
Before choosing a dashboard, write down who owns each definition:
- Revenue: Decide whether the business uses gross sales, net sales, or another finance-approved measure.
- New customer: Define whether the label is based on Shopify customer history, order status, or a reporting tool's identity logic.
- CAC: Separate new-customer acquisition cost from blended marketing spend.
- Margin: Document how product cost, fulfillment, returns, discounts, and advertising enter the calculation.
Then reconcile those definitions across Shopify, Meta, Google Analytics, Klaviyo, the ERP, the 3PL, and subscription systems. A semantic layer isn't a decorative data model. It's the agreement that lets finance, marketing, and operations trust the same number.
#Operational blind spots cost more than ugly dashboards
Standard ecommerce reports often overemphasize revenue, sessions, and ROAS. They can miss inventory mismatches, mobile performance gaps, fulfillment problems, and post-purchase failures. A commerce-operations report found that only 36% of retailers believed they had full inventory visibility, while 57% reported minor visibility issues, according to Linnworks' State of Commerce Ops 2025 report.
That's why a founder should ask whether a tool can connect product availability, device performance, customer retention, and backend orders. A report that says a product is selling well without showing its stock position can encourage a campaign that accelerates a stockout. A report that shows revenue growth without fulfillment status can hide the reason refunds and repeat purchases are deteriorating.
Practical rule: Don't approve a dashboard until you can explain who owns each metric and which operational action follows a negative signal.
#Real Shopify DTC Workflows and Reporting Cadences
A Shopify reporting routine works when each review has a narrow purpose. Checking every metric every day creates activity, not control.
| Cadence | Key Metrics | Action Trigger |
|---|---|---|
| Daily | Conversion rate, checkout conversion rate, cart abandonment rate | Investigate sudden movement, payment friction, site issues, or traffic-quality changes |
| Weekly | AOV, return rate, channel spend, contribution margin | Reallocate spend, review merchandising, and investigate margin pressure |
| Monthly | Repeat purchase rate, cohort retention, customer mix | Adjust lifecycle marketing, product strategy, and acquisition payback expectations |
The cadence above follows industry guidance that places conversion and abandonment in daily reviews, AOV and return rate in weekly reviews, and repeat purchase rate in monthly analysis. Shopify's reporting guidance also recommends combining sales, customer, marketing, inventory, and technical-health metrics, including stock levels, sell-through, page load times, device usage, and uptime, as described in Mailchimp's ecommerce dashboard guidance.
#When revenue drops suddenly
Start with Shopify orders and compare the change across sessions, conversion, AOV, and product availability. If sessions are stable but conversion declines, split the funnel by device and inspect checkout completion. If conversion holds but revenue falls, examine AOV, discounts, refunds, and product mix.
Next, compare ad spend and traffic sources with the store's first-party order data. Don't pause every campaign because total revenue is down. Isolate whether the issue is acquisition volume, traffic quality, checkout friction, or a product-level stock problem, then assign one owner to validate the suspected cause.
#When a new channel looks profitable
Pull the channel's spend, first-time customer count, attributed revenue, blended MER, new-customer CAC, and contribution margin. Then compare the channel's reported conversions with Shopify orders and remove duplicated customer or purchase records.
Keep the channel under review through a cohort lens. If customers take longer to repurchase, short-window ROAS may understate the channel's value, but delayed payback still needs to fit the brand's cash-flow tolerance.
#When repeat purchase stalls
Separate recent customers by acquisition cohort, first product purchased, discount status, and lifecycle touchpoint. Review whether the product that begins the customer relationship is available, whether replenishment timing matches the email flow, and whether returning customers behave differently on mobile.
The monthly decision may be a retention offer, a better post-purchase sequence, a product education campaign, or an inventory correction. The report should end with one or two actions, not a larger list of charts.
#Buyer's Checklist and ROI Evaluation Framework
Feature comparison tables often reward tools that collect integrations, chart types, and alert options. Founders should evaluate whether the software creates a reliable path from question to decision.
#Four questions to ask in a demo
Can it integrate thoroughly? Confirm that the tool connects Shopify orders with ad platforms, email, customer data, inventory, accounting, and 3PL information where those systems matter. A superficial connector can create the appearance of centralization while leaving margin and fulfillment outside the model.
Who owns the definitions? Ask to see the calculation for revenue, CAC, LTV, AOV, new customer, returning customer, and contribution margin. Then ask how the tool handles refunds, cancellations, duplicate orders, delayed conversions, and subscription events.
How quickly can someone answer a real question? Use a question from last week, such as “Why did revenue fall despite stable traffic?” A good evaluation should show the path from source data to explanation without requiring a custom analyst project for every investigation.
Does it show the next action? A chart can identify movement, but it doesn't prioritize the response. Look for explanations that connect a signal to urgency, owner, expected business impact, and a practical next step. An overview of business intelligence reporting can help teams distinguish reporting that displays information from reporting that supports operating decisions.
#Evaluate return without fictional precision
Build the ROI case from observable work:
- Reporting time saved: Record how much time the team spends exporting, cleaning, reconciling, and presenting data.
- Faster decisions: List decisions that currently wait for manual analysis, such as budget changes, stock investigations, or lifecycle fixes.
- Revenue protected: Track problems caught earlier, including broken checkout paths, wasteful ads, stock mismatches, and failed retention flows.
- Trust gained: Note whether finance and operators can use the same report without rebuilding the numbers independently.
Don't justify a purchase with an assumed conversion lift. Run a trial, document the questions the team asks, and measure whether the tool produces answers with less manual work and fewer reconciliation disputes.
#Integration and Setup Considerations for Shopify Stores
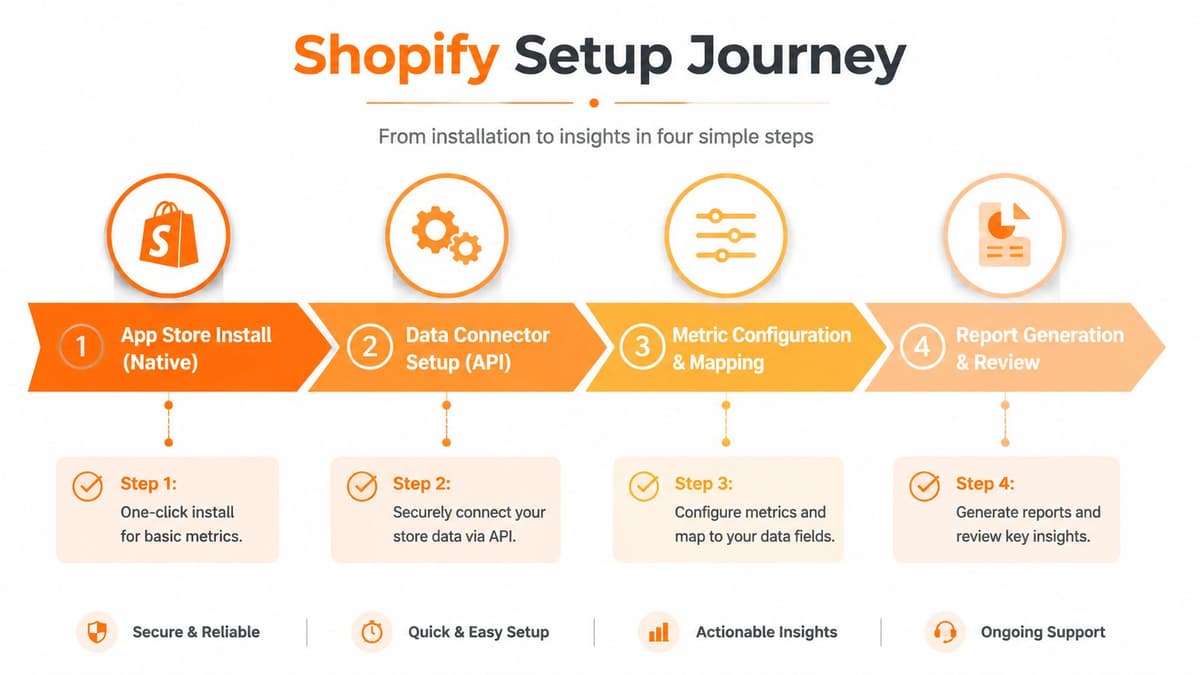
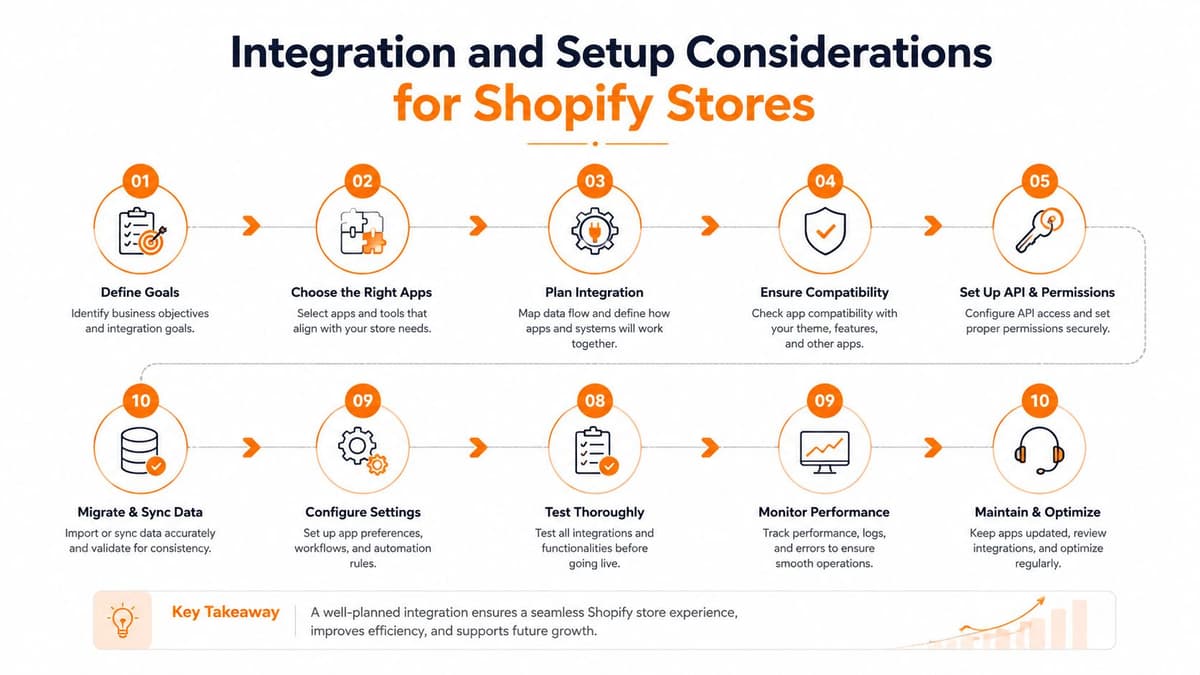
Shopify App Store installs and enterprise data projects are different implementations. A native app may connect quickly with limited configuration, while a larger setup can require source mapping, identity rules, warehouse modeling, and onboarding sessions. Choose based on the complexity your team has, not the sophistication of the vendor's architecture diagram.
During the first week, validate the foundation before trusting the conclusions. Use a small reconciliation checklist:
- Compare reported orders with Shopify backend orders.
- Check that duplicate purchases aren't counted twice.
- Separate first-time and returning customers.
- Match ad spend with platform invoices and account records.
- Confirm refunds, cancellations, discounts, and taxes follow the agreed definition.
- Review whether missing events or delayed data create inflated conversion counts.
- Check cohort-based ROAS and whether payback timing is visible.
- Reconcile the report against backend orders every week.
Modern attribution guidance emphasizes de-duplicated purchases, user-level analysis, first-time versus returning customer separation, and cohort-based ROAS. Those checks matter because silent event loss can make a dashboard look cleaner while subtly corrupting the underlying conversion count.
For stores that also need accounting alignment, a practical guide to accounting software for Shopify stores can help clarify how storefront transactions should connect with financial records. The reporting layer should complement accounting, not replace the ledger or create a second unofficial version of financial truth.
The first 30 days should focus on validation before optimization. Confirm the data model, document metric owners, compare reports with backend orders, and only then use the tool to make budget or merchandising decisions.
A short technical walkthrough can also help operators understand how data moves between a Shopify store and reporting systems.
#How AI-Powered Weekly Reports Close the Reporting Gap
The reporting gap closes when a system does more than collect data. An AI-powered weekly report can interpret sales, traffic, customer, and product signals together, then explain what changed, why it matters, and what deserves attention first.
Arlo.’s “20 Minute CMO” report is one example of that model. It reads Shopify performance and can use Meta Ads and Google Analytics data to produce a concise weekly interpretation. The output ranks action items by urgency and dollar impact, estimates revenue opportunity, and highlights what's working so the team doesn't cut a profitable activity while chasing a new problem.
That approach addresses three recurring failures:
- Trust: One consistent interpretation gives finance and operators a shared starting point.
- Operations: The analysis can surface mobile and desktop gaps, broken email flows, product issues, and other signals that a revenue-only dashboard misses.
- Actionability: The report recommends what to investigate or change instead of leaving the founder to interpret another graph.
Teams considering autonomous analysis can also review these AI agents use cases to understand where automated interpretation fits into recurring operating work.
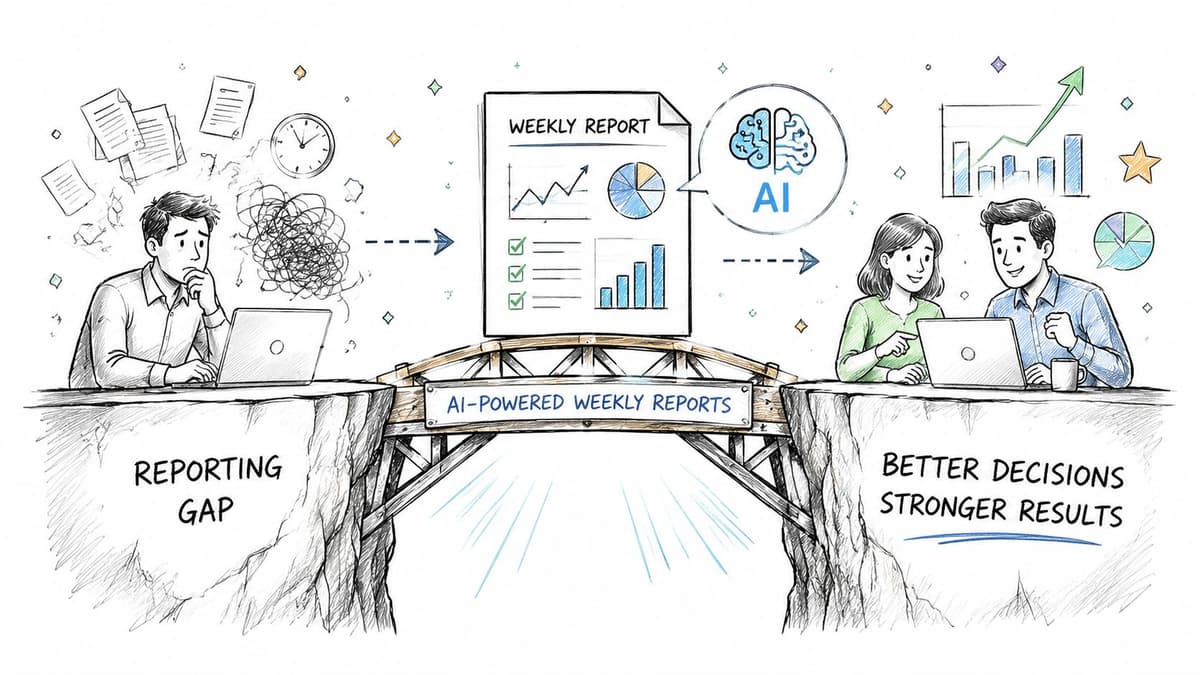
The Monday-morning test is simple. Can you open one report, understand the meaningful changes, and assign the next actions without reconciling four dashboards first? If not, the problem probably isn't a shortage of charts.
Arlo turns Shopify store data into a concise weekly report that explains what changed, why it matters, and what to do next, with priorities ranked by urgency and dollar impact. Visit Arlo to start the 14-day free trial, install through the Shopify App Store in minutes, and replace scattered dashboard checks with a focused weekly growth review.