Referral Program Effectiveness: A Guide for 2026
By Arthur Falcone · Founder of Arlo
More shares don't automatically make a referral program effective. A store can generate plenty of clicks, codes, and enthusiastic dashboard graphs while producing little attributable profit. The operator's job isn't to maximize sharing volume. It's to prove that an advocate's referral creates profitable orders, then improve the weakest step in that chain.
For Shopify merchants, that means treating referral program effectiveness as a measurement discipline first and a growth tactic second. Instrument the journey, separate participants from real advocates, compare referred customers with paid cohorts, and prioritize tests by expected revenue impact. Incentives and creative matter, but they can't rescue a funnel you can't measure.
#Table of Contents
- Why Most Referral Programs Look Better Than They Are
- The Five Numbers That Define Referral Program Effectiveness
- Instrumenting Tracking in Shopify and Common Referral Apps
- Realistic Benchmark Ranges for Ecommerce Referral Funnels
- Diagnosing Where Your Referral Funnel Is Breaking
- Prioritized Tests to Improve Referral Conversion and Revenue
- Estimating Revenue Impact and What to Do This Week
#Why Most Referral Programs Look Better Than They Are
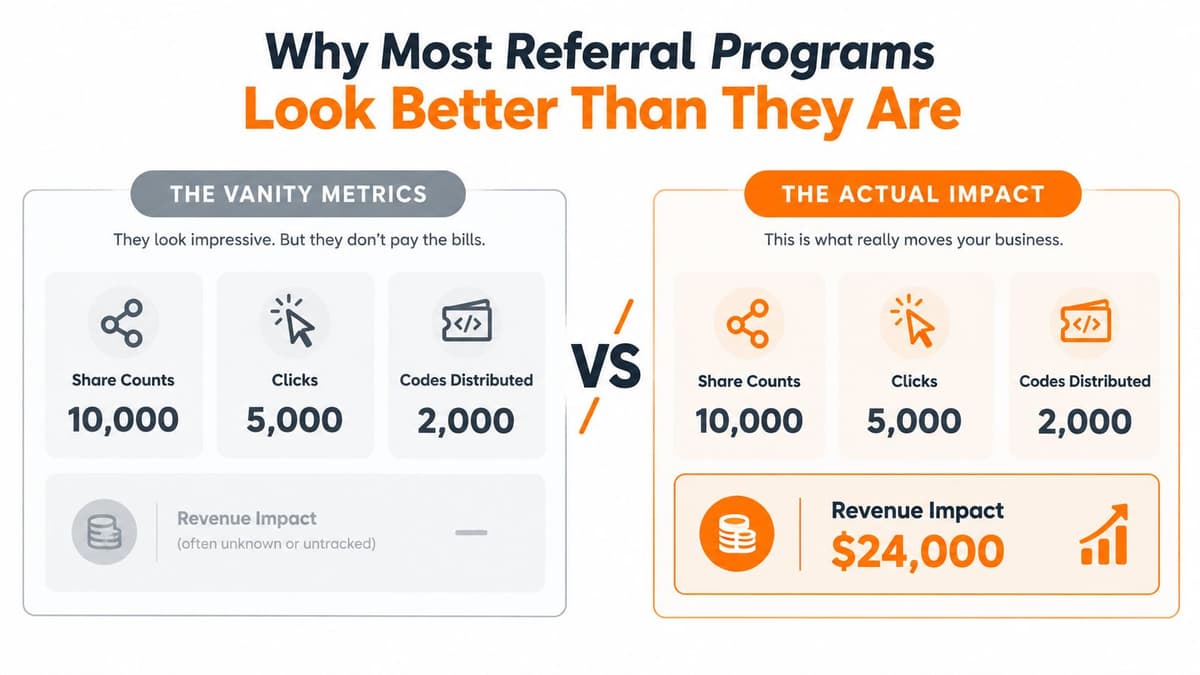
The most popular advice says to make sharing easier and encourage more customers to send links. That advice skips the harder question: what happened after the share? Share counts, clicks, and distributed codes are activity metrics. They don't prove that a referral produced an order, profitable revenue, or a customer who returns.
A program generating thousands of shares and very few orders is failing, even if its app dashboard reports positive engagement. A quieter program that produces consistent attributed revenue from a small group of active advocates is doing its job. Effectiveness should be judged by attributable revenue per active advocate, not raw referral volume.
#Separate participation from advocacy
A participant is anyone who received a referral link, saw a program prompt, or opened a referral page. An active advocate has shared at least once during your chosen measurement window. Those populations behave differently, and combining them makes a weak program look larger than it is.
Track two revenue views:
- Referral-attributed revenue is revenue assigned directly to a referral link, code, or recorded source.
- Referral-influenced revenue includes orders where referral exposure played a role but another channel received the final click.
Last-click attribution can undercount referral value when a recipient returns through a branded search or direct visit. Broad view-through attribution can inflate it by claiming credit for people who would've purchased anyway. Use direct attribution for financial reporting, then analyze influence separately rather than blending both into one flattering number.
The available benchmarks show why funnel quality matters. Referred traffic typically converts at about 2.5% to 3.5%, compared with 0.5% to 1% for paid social traffic, while healthy ecommerce referral programs often drive only 1% to 3% of total customers through referrals at baseline (Shopify's referral marketing statistics). The useful conclusion isn't that every store should chase a fixed referral share. It's that referred-visit-to-order performance deserves more attention than sharing volume.
Practical rule: Never approve a referral test because shares increased. Approve it when attributable orders, contribution margin, or referred-customer quality improved.
If you operate a local or experience-led store, examples of proven referral strategies for restaurants can help you think beyond generic ecommerce discounting. The same principle applies: connect the referral action to a measurable customer outcome.
#The Five Numbers That Define Referral Program Effectiveness
A referral dashboard should diagnose the funnel in operating order. Start with reach among valuable customers, then move through sharing, visits, orders, acquisition cost, and customer quality. Broad ecommerce KPI guidance is also useful when building the wider reporting layer, so use this Shopify KPI framework alongside your referral view.
#1. Active advocate rate
Calculate active advocates divided by repeat purchasers over a defined period, such as 90 days. This tells you whether satisfied customers are taking action, rather than whether customers merely encountered a referral widget.
A low rate can indicate weak product delight, poor timing, unclear rewards, or a program that's hard to find. Don't immediately increase the reward. First check whether the prompt appears after delivery, a positive review, or another moment when the customer has a credible reason to recommend the product.
#2. Share-to-visit rate
Measure shared links that generate a click within the attribution window. A share-to-visit rate below 20% on email or 8% on SMS is a practical warning sign for deliverability, targeting, or message relevance, not automatically a copywriting problem.
Inspect whether links are being stripped, whether recipients recognize the sender, and whether the message explains the friend's benefit. A beautiful share surface won't fix an email that lands in spam or an SMS sent to an unresponsive segment.
#3. Referred visit-to-order conversion
This is the first hard revenue metric. Compare referred traffic with paid traffic, but keep the audiences and landing experiences visible in the analysis. Referred visitors should arrive with context from the advocate, so a rate under 1% on warm traffic suggests a mismatch between the offer, landing page, product promise, or checkout experience.
Industry datasets commonly place median referral conversion at 3% to 5%, with top-quartile programs reaching 8% or more (GrowSurf's referral ROI benchmarks). Treat these as comparison points, not universal targets.
#4. Referral CAC
Include every cost that follows the referral: advocate reward, recipient discount, free shipping, payment fees where relevant, and operational costs. Compare the resulting referral CAC with blended CAC and with the margin available on the first order.
A low acquisition cost isn't a win if the incentive consumes contribution margin or attracts one-time bargain seekers. Report CAC alongside order margin and subsequent purchase behavior.
#5. Referred LTV and repeat rate
Create cohorts for referred customers and compare their repeat rate and value with paid-acquired customers. Peer-reviewed evidence summarized by Wharton finds referred customers can have 16% to 25% higher long-term value, but the effect varies by segment, so don't apply the uplift blindly (Wharton's referral program research).
The important question is whether your own referred cohort repurchases at a healthy margin after incentives. If it doesn't, the program may be optimizing first-order conversion while damaging customer quality.
#Instrumenting Tracking in Shopify and Common Referral Apps
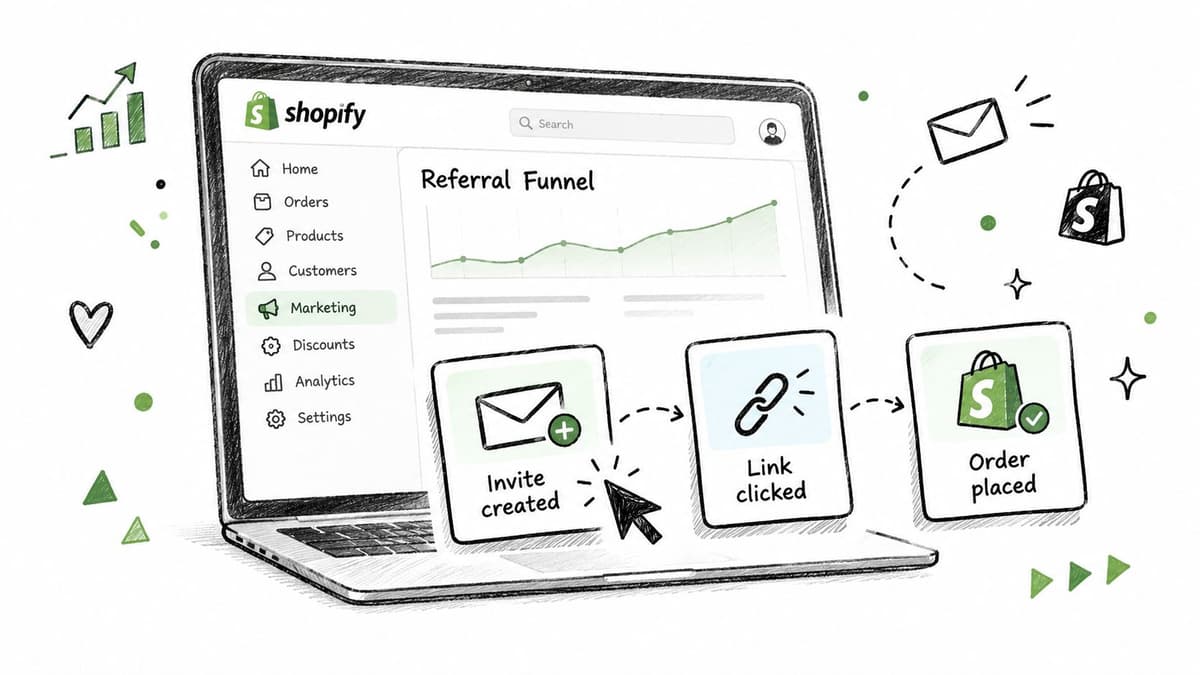
Referral effectiveness starts with reliable measurement. Build an event path for invite created, invite sent, link clicked, landing page visited, signup or add-to-cart, order placed, and revenue captured. Attach a stable referral identifier to every event so the path remains connected through checkout and reporting.
Apps such as Yotpo, ReferralCandy, and LoyaltyLion may use UTM parameters, referral IDs, or unique discount codes. Field names vary, so normalize them into shared fields for source, advocate, recipient, order, and reward. This gives Shopify, the app, and analytics tools the same attribution language. For a broader explanation of how these systems fit together, review this guide to attribution marketing software.
#Use a click-path verification process
- Create a test invite. Confirm that the advocate ID, campaign, and reward terms are recorded.
- Send the invite. Open it on mobile and desktop. Check that the referral parameters remain in the link.
- Visit the landing page. Follow the journey through navigation, account creation, and add-to-cart. Verify that the referral source persists.
- Place a test order. Confirm that Shopify order metadata contains the referral tag and that the intended discount code is attached.
- Reconcile revenue. Match the Shopify order, the referral app conversion, and the analytics report.
Inspect order details in Shopify admin rather than trusting the app dashboard alone. Confirm that the referral source survives checkout, then verify discount-code lineage in Orders. A code containing a referral name does not prove that the order belongs to the program. In GA4 or Shopify analytics, filter by the normalized referral source and exclude internal test orders.
#Audit the breaks that dashboards hide
Cookie loss before checkout can remove advocate credit. Same-device purchases may receive credit from paid search or branded traffic instead. Multi-touch orders can divide attribution across channels, and email clients may strip or rewrite tracking parameters.
Use server-side deduplication so one order cannot trigger multiple rewards. Reconcile app conversions with Shopify orders daily, or use a consistent operating cadence that catches discrepancies before reporting. The goal is a verified revenue trail, not a polished dashboard built on incomplete events.
#Realistic Benchmark Ranges for Ecommerce Referral Funnels
Referral benchmarks are useful only after the funnel is measured consistently. Product price, gross margin, purchase frequency, subscription structure, and advocate quality can shift results substantially. Treat the ranges below as comparison points, not targets to copy.
#Referral Funnel Benchmarks by Performance Tier
| Funnel Stage | Bottom Quartile | Median | Top Quartile | Top Decile |
|---|---|---|---|---|
| Share-action rate | Below typical baseline | Typical program level | 4.64% | 13.38% and above |
| Referred visit-to-order conversion | Below 3% | 3% to 5% | 5% to 8% | 8% and above |
| Referral customer share of total customers | Around 1% | 1% to 3% | Above baseline | Mature program level |
| Referral revenue share | Limited or unclear | Measurable contribution | 10% to 30% | Upper end of mature contribution |
| Program ROI | Difficult to verify | Positive after full costs | Strong contribution | Mature programs can reach 8x to 12x ROI over three years |
Use each band to choose the next diagnostic. Low share activity usually points to weak advocate motivation, poor placement of the referral prompt, or unclear recipient value. Strong sharing with low referred visit-to-order conversion shifts attention to the landing page, offer terms, shipping costs, and checkout friction. A small customer or revenue share can be acceptable for a young program, but an unclear result often means attribution or reward costs are not reconciled.
The share-action figures come from ReferralCandy's ecommerce benchmarks. Compare the stage that is failing, not just the final program average. Strong sharing can coexist with weak order economics, while modest sharing can still produce profitable customers if margin and repeat purchase behavior are favorable.
Revenue per 100 emails sent depends on conversion, AOV, margin, and reward cost. Calculate orders and contribution revenue from the tracked funnel before judging creative or incentives. For a broader baseline, compare that result with your store's historical performance using performance benchmarking for ecommerce. This keeps testing focused on measurable revenue impact rather than a headline conversion rate.
#Diagnosing Where Your Referral Funnel Is Breaking
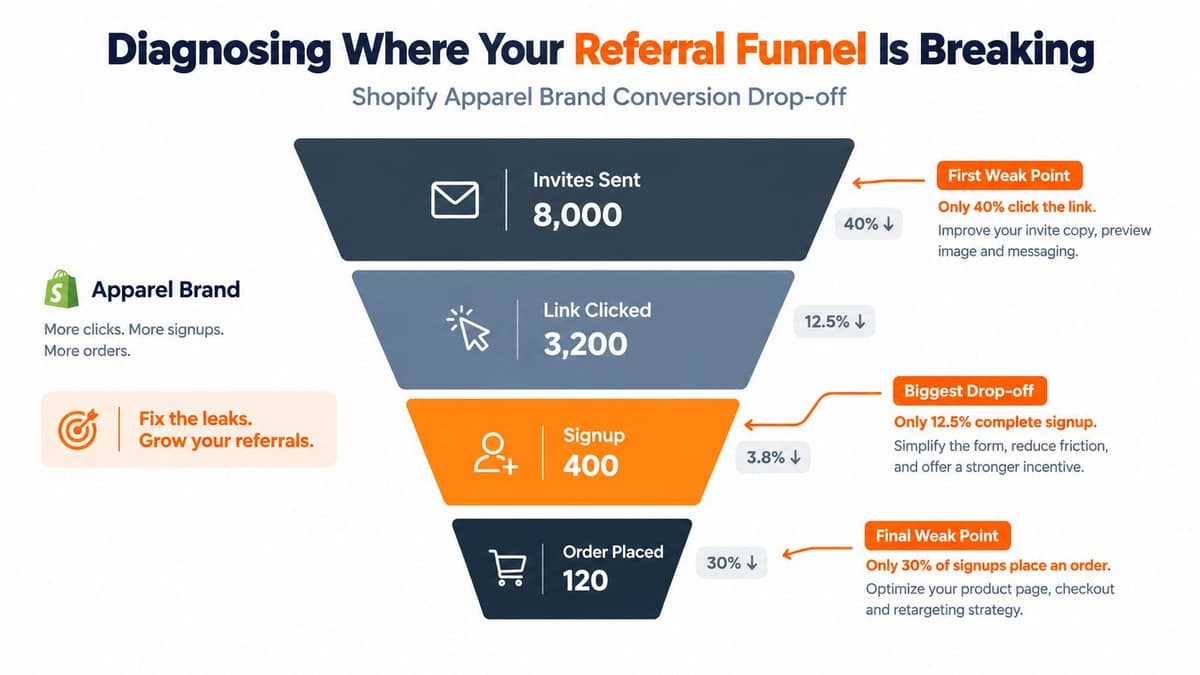
A funnel's shape tells you more than its total. Consider a Shopify apparel brand with strong invite activity but weak referred-visit-to-order conversion. Its revenue per active advocate is roughly one-fifth of the top-decile level, even though the program looks healthy at the sharing stage.
#Read the drop-off in sequence
Start by comparing each stage with the relevant benchmark band. If invites generate clicks above the store's normal range but signup or order completion falls sharply, don't spend the first hour rewriting the share message. The evidence points downstream.
| Symptom | Likely cause | Cheapest diagnostic |
|---|---|---|
| Low click-through after many sends | Weak targeting, deliverability, or unclear recipient benefit | Test links across email clients and review delivery logs |
| Strong clicks but high landing-page bounce | Message-to-page mismatch or slow mobile experience | Compare mobile session recordings with the advocate's wording |
| Engaged browsing but few orders | Incentive, price, shipping, or product promise problem | Run a recipient-benefit offer test and inspect checkout exits |
| First purchase but weak repeat behavior | Advocate promise doesn't match product reality | Compare referred cohorts by product, refund, and repeat order |
| Orders missing referral credit | Cookie, code, or parameter persistence failure | Trace one test order from link click to Shopify metadata |
A referral funnel guide from Netco Design LLC's sales funnel tips is useful for thinking about the handoffs between attention, consideration, and conversion. Apply that logic to referral-specific evidence instead of assuming every leak is an incentive issue.
#Check instrumentation before fixing experience
Safari cookie loss, checkout redirects, and referral codes that disappear from the cart can create a false conversion problem. Reproduce the journey on the devices your customers use, then compare app records with Shopify order metadata.
If tracking is intact, inspect cohort behavior. A referred visitor who buys once but never returns may have responded to a discount without becoming a good customer. That calls for product, promise, or segment analysis, not just a larger reward.
#Prioritized Tests to Improve Referral Conversion and Revenue
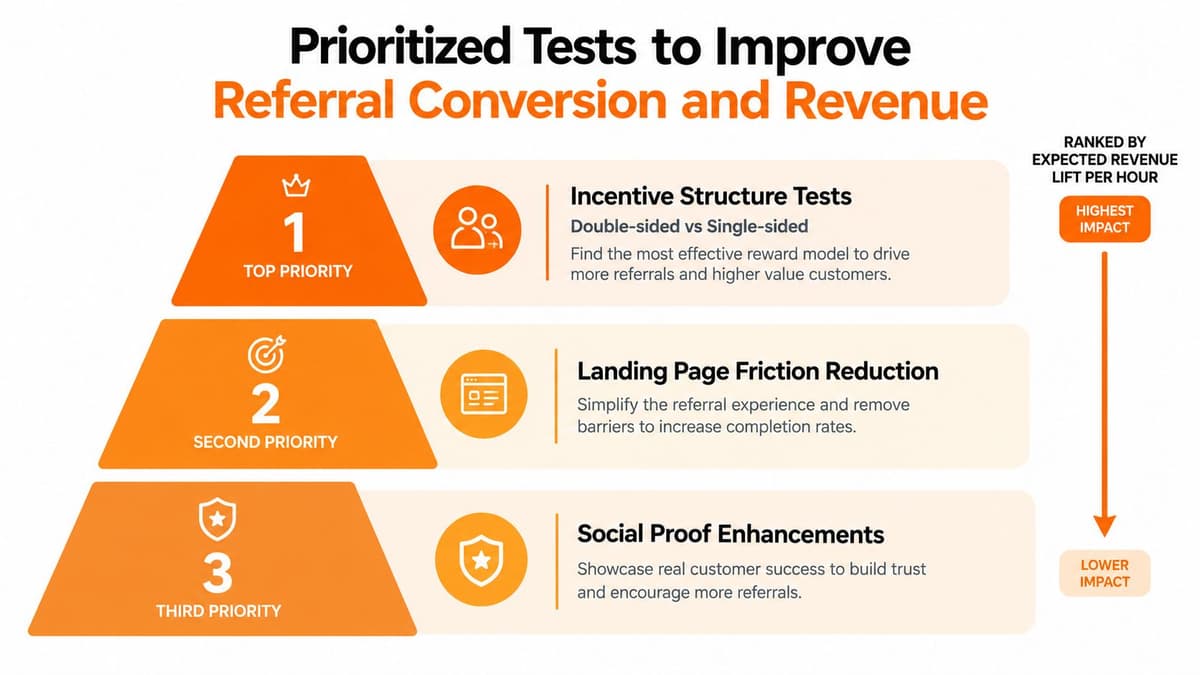
Small Shopify teams shouldn't test whatever looks most interesting in the app editor. Rank experiments by expected revenue lift per hour of work, then keep one success metric that proves the result isn't merely moving credit from another channel.
#Start with the economic lever
Test double-sided versus sender-only rewards, dollar value versus percentage discount, and flat versus tiered structures. Incentive design can affect both participation and purchase intent, but the correct choice depends on margin, product novelty, and whether the recipient needs reassurance.
Research on new offerings found that public referral rewards can reduce referral likelihood, while hiding the reward from recipients, increasing reward size, or rewarding both sides can mitigate that effect (Journal of Marketing Research incentive study). That makes transparency a test variable, not a universal best practice.
Use a clean test with one primary metric, such as referred visit-to-order conversion. Don't claim a winner from a handful of orders. Set the minimum sample in advance, and wait until each variant has enough referred visits and orders to make the comparison meaningful.
#Then remove friction
Landing-page copy, share prompts, prefilled messages, mobile share-sheet behavior, and post-purchase placement are cheaper to change than the reward budget. Test the recipient's benefit first, make the product context obvious, and place the ask after a positive experience rather than immediately after an uncertain purchase.
Measure share-to-visit for the share surface, bounce and product engagement for the landing page, and referred orders for the full path. A click increase without an order increase isn't a win.
#Treat social proof as a supporting test
Social proof can reduce uncertainty, especially for a new or unfamiliar product, but it shouldn't outrank broken attribution or a weak offer. Test testimonials, customer photos, product-specific proof, and advocate messages after the core journey works.
This short video can provide an additional visual reference for prioritizing referral experiments:
#Estimating Revenue Impact and What to Do This Week
Use a simple Shopify-friendly formula:
Monthly direct referral revenue = referred orders × AOV.
For example, 500 invites × 2% order conversion × $65 AOV = $650 in direct monthly referral revenue. A realistic upper bound is higher when repeat purchases are included, but don't annualize that upside until your referred cohort demonstrates repeat behavior.
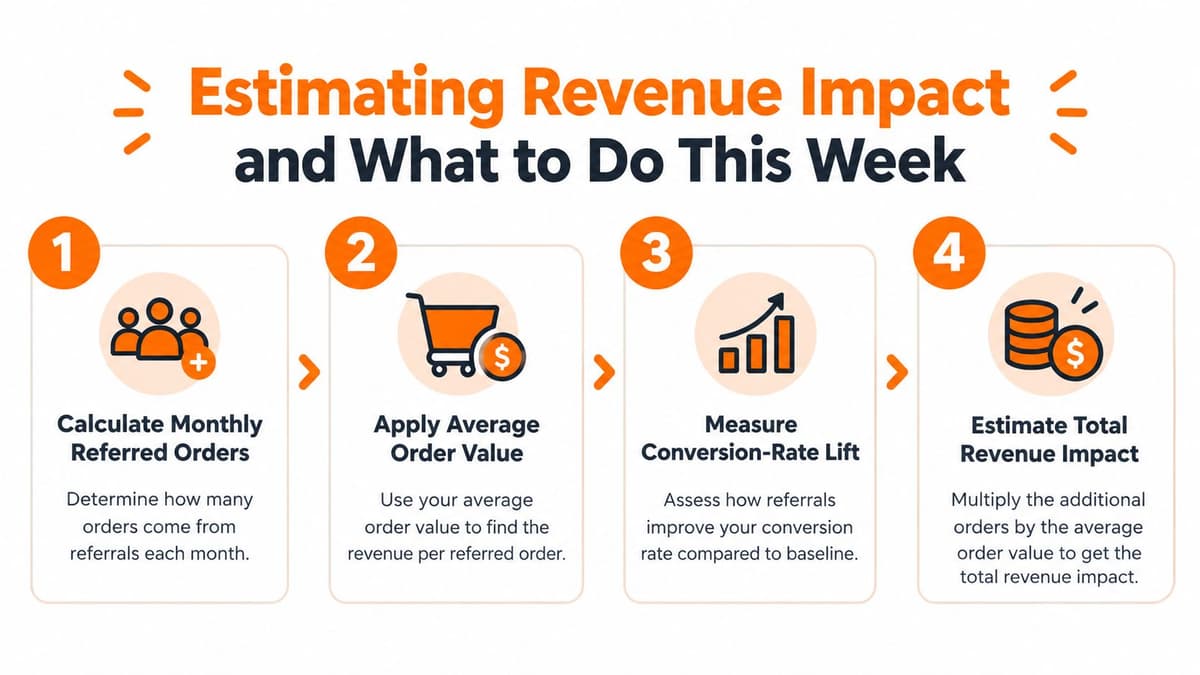
This week, pull last month's referral funnel, calculate share rate, identify the largest drop-off, choose one prioritized test, and schedule a re-measurement after 14 days. Record one number before you change anything, such as referred visit-to-order conversion, so the test has a clear verdict.
Arlo turns Shopify sales, traffic, customer, and product data into a weekly report that explains what changed, why it matters, and which actions have the greatest urgency and dollar impact. If you want referral performance evaluated alongside the rest of your store's growth signals, visit Arlo and connect your Shopify store.