Website Traffic Sources: Measure and Prioritize Channels
By Arthur Falcone · Founder of Arlo
You can feel it on a Monday morning. Shopify says one thing, GA4 says another, Meta Ads Manager insists it drove more conversions than your store recorded, and your team is left guessing which dashboard deserves trust. The frustrating part is that website traffic sources aren't raw facts, they're interpreted data, shaped by tagging, attribution rules, and the holes in your tracking setup.
That's why founders get misled by their own reporting. A channel can look “dead” in one platform and healthy in another, while direct traffic swells because campaign tags were missing or referrers got stripped on the way in. On a broad web benchmark, organic search is reported as the largest single source of traffic globally at 53.3%, with direct traffic at 20.2% and referral traffic at 11.2% (benchmark set). But commerce looks different, because one e-commerce benchmark reports direct 27.6%, organic search 26.7%, and paid search 23.0% of traffic (commerce benchmark). The mix changes by site type, audience intent, and measurement method, which is why a founder-led Shopify store can't borrow a SaaS benchmark and call it strategy.
The right way to read traffic is as a diagnostic system, not a scoreboard. If you're seeing conflicting conversion counts, stale channel totals, or a suspiciously strong direct bucket, the fix is usually in the plumbing, not the ad spend.
#Table of Contents
- Why Your Traffic Dashboard Tells Conflicting Stories
- The Seven Website Traffic Sources Every DTC Store Should Track
- How Attribution Actually Works in GA4 and Shopify
- The Direct Traffic Illusion and How to Fix It
- Prioritizing Channels for Revenue Growth
- Emerging Traffic Sources Beyond Traditional Search and Social
- Your Weekly Traffic Source Review Checklist
#Why Your Traffic Dashboard Tells Conflicting Stories
Monday morning usually starts with a founder clicking through three tabs. Shopify shows one conversion count, GA4 shows another, and Meta Ads Manager is somehow the most optimistic of the three. The instinct is to assume one platform is wrong, but the situation is messier. Each system is measuring a different slice of the journey, and each one has incentives and blind spots that distort the picture.
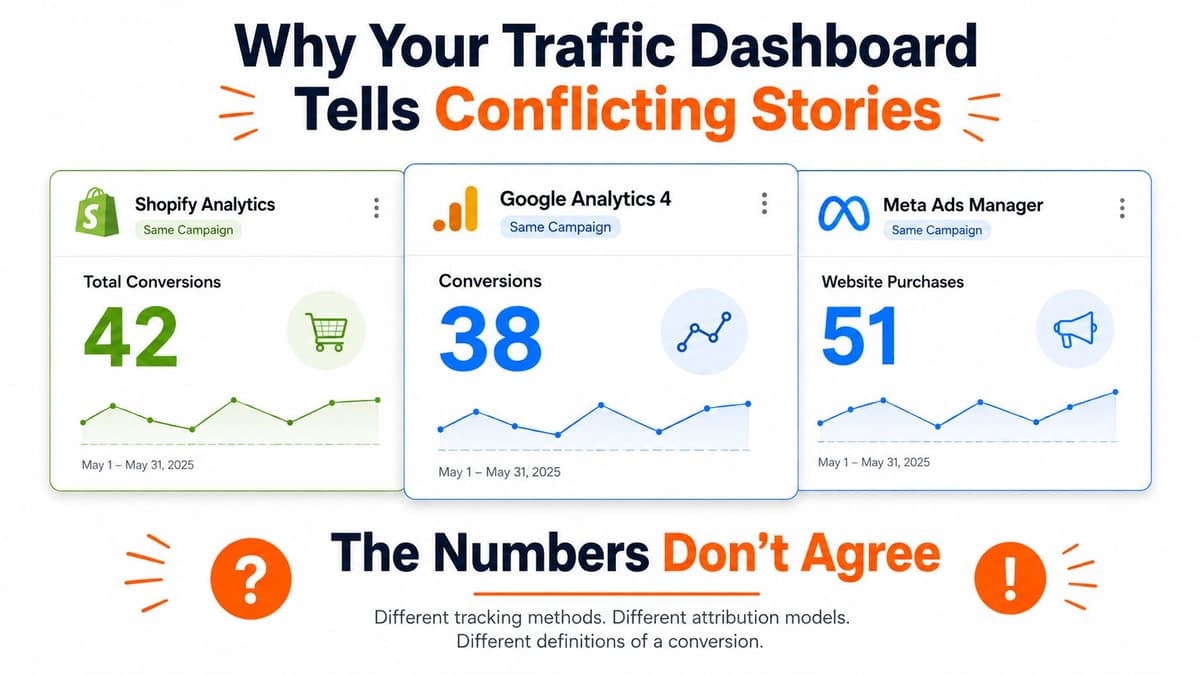
The first mistake is treating channel mix like a universal truth. It isn't. In one benchmark, organic search leads overall traffic at 53.3% globally, while in commerce the mix shifts toward direct 27.6%, organic search 26.7%, and paid search 23.0% (global benchmark). That matters because a content-heavy brand, a SaaS brand, and a Shopify store don't acquire customers the same way, and their dashboards won't agree for the same reason.
#The real source of the conflict
The disagreement often comes from attribution, not performance. GA4 can classify the same visit differently depending on source, medium, source/medium, campaign, and default channel grouping, which is why a single click can land in different buckets if UTM tags aren't clean (GA4 traffic source analysis). Shopify, meanwhile, tends to simplify the story by leaning on last-click logic. Those models answer different questions, so the same sale can look like a win for paid in one tool and a direct visit in another.
Practical rule: when dashboards conflict, don't ask which platform is “right.” Ask which one is closest to the decision you need to make.
That shift in thinking changes how you use the data. If you're deciding whether to keep a profitable paid campaign alive, the ad platform's conversion signal matters. If you're deciding whether your brand has organic demand, Shopify's revenue view won't tell the whole story. For a broader operating lens, compare your store numbers against a clean analytics foundation such as the framework in Arlo's ecommerce analytics guide, then audit whether each channel has been tagged and classified consistently.
The point isn't to eliminate disagreement. The point is to understand why it exists before you reallocate budget based on a dashboard illusion.
#The Seven Website Traffic Sources Every DTC Store Should Track
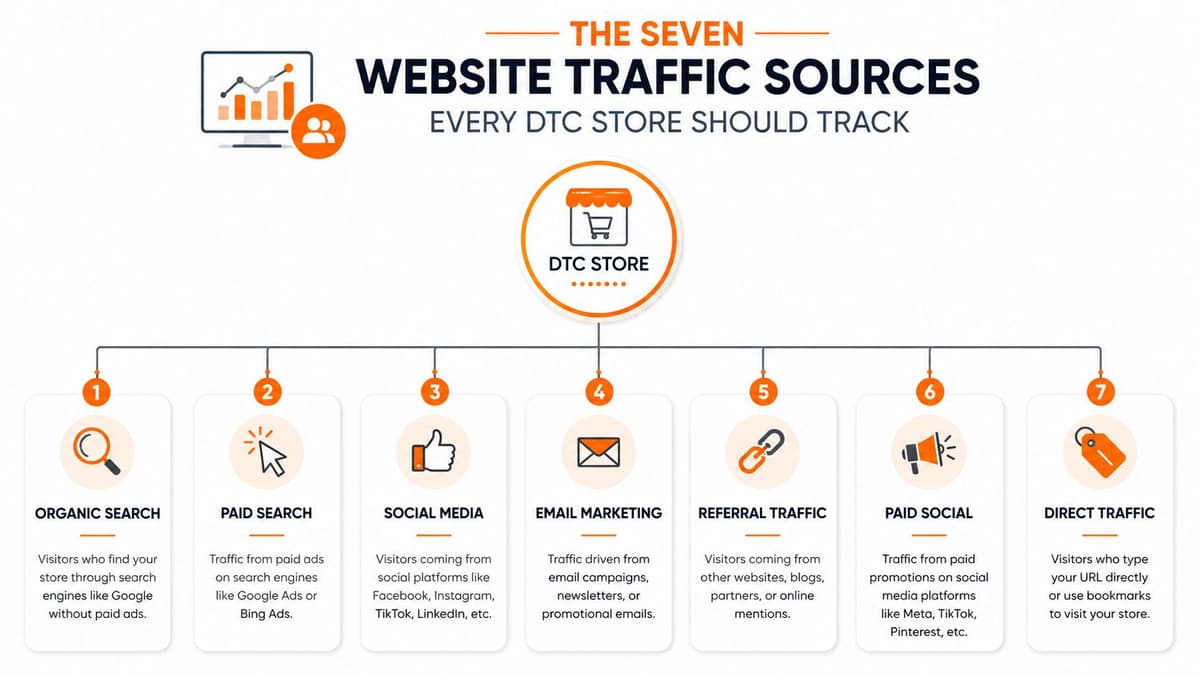
A founder can open a Shopify dashboard, see traffic split into a few broad buckets, and still miss where revenue is really coming from. The useful framework is narrower and more operational. Track direct, referral, organic, social, email, paid, and unknown traffic, then read each source as a behavior pattern instead of a generic label (standard framework). If the review stops at “search versus social,” the channel mix gets too blurry to use for budget decisions.
#What each bucket usually contains
Direct traffic is the least clean bucket in the stack. It can include typed URLs and bookmarks, but it also absorbs visits with missing referrer data, which turns it into a mixed signal rather than a pure channel (direct traffic explanation). In Shopify, a large direct share can mean returning customers are coming back on purpose, or it can mean tracking is leaking somewhere upstream.
Referral traffic comes from another site. For Shopify brands, that often means press coverage, affiliate placements, creator roundups, comparison pages, or partner sites. The intent behind those clicks can vary a lot, because a credible review site and a casual mention in a blog post both show up as referral traffic while driving very different purchase behavior.
Organic search is traffic from unpaid search results. In GA4 and most analytics tools, you see search-led discovery, long-tail intent, and pages that keep attracting visitors without media spend. Healthy organic growth usually means category pages and education content are earning attention on their own.
Social includes organic social and paid social, depending on tagging and platform rules. For DTC operators, this source often looks active but converts unevenly, because social frequently introduces the brand before the sale happens. The best read on social is not raw clicks, it is whether those clicks assist later revenue.
Email is the channel founders undercount most often when tags are sloppy. It should be treated as owned demand, not just campaign volume. If email traffic keeps landing in direct or unknown, the tagging setup is weak and the channel mix is less reliable than it looks. A cleaner attribution setup, like the one covered in this guide to attribution marketing software, helps separate real email response from noise.
Paid covers paid search and paid social, but those need to be separated in reporting because they behave differently. Paid search usually captures people who are already showing intent, while paid social more often creates demand earlier in the journey. Lumping them together hides that trade-off.
Unknown is the catchall for sessions the platform cannot classify. If this bucket grows, the right response is not to treat it as a healthy miscellaneous source. Check tagging, redirects, and platform rules first, because that bucket often hides broken attribution rather than new demand.
#How to read the mix
The question is not which source is “best.” It is which source is carrying its share of the revenue load. A store with strong organic and referral traffic may be much less fragile than one that depends on paid traffic for every sale. A store with an oversized direct bucket can look healthy until you realize campaign attribution has been leaking for months, which is common on founder-led Shopify stores with inconsistent UTM discipline.
Read the mix like a portfolio. That matters when you compare content sites, SaaS traffic, and commerce stores, because the same source label can mean very different things once revenue, attribution quality, and repeat purchase behavior are in the same view.
#How Attribution Actually Works in GA4 and Shopify
A Shopify founder can look at the same sale in two dashboards and get two different answers. GA4 is classifying the session, while Shopify is recording the order that closed. If you do not understand how those systems label traffic, you end up optimizing the wrong channel and missing where revenue came from.
GA4 does not store traffic as a single label. It breaks each visit into multiple dimensions, and each one answers a different question. That includes session source, session medium, session source/medium, session campaign, and the default channel grouping (GA4 dimension breakdown). If your team only checks one field, channels with different economics get collapsed into the same bucket.
#Why one visit can wear different labels
A visit can show up as paid, email, referral, or organic depending on the URL parameters and the referrer data that survives the journey. That is why UTM discipline matters so much. If one campaign uses utm_medium=email, another uses newsletter, and a third has no tags at all, the same marketing effort can split across several reports or disappear into direct traffic.
Operational rule: if a campaign cannot be identified from the URL or referrer, assume attribution will drift until the tagging is fixed.
Shopify and GA4 also answer different questions. Shopify is closer to the order that closed. GA4 is closer to the session that arrived. Those views should be compared, not blended, because one is more useful for revenue reporting and the other is more useful for journey analysis. For founder-led DTC stores, that difference matters when email, paid social, creators, and referral traffic all contribute to the same purchase path.
#The tagging discipline that prevents channel bleed
Clean measurement starts with consistent tags. Every paid, email, referral, and social link should follow a naming convention the whole team can repeat. If your store sends traffic from Klaviyo, Meta, creators, or affiliates, those links need to be tagged the same way every time or they will bleed into the wrong bucket. That is a common reason founders see direct traffic rise while campaign effort stays flat.
A cleaner attribution stack also helps you spot where a session should have landed but did not. A practical setup guide like Arlo's attribution software overview can help when you are building a consistent reporting layer around Shopify and trying to reconcile channel disputes without relying on guesswork.
The practical takeaway is simple. Use GA4 for channel behavior, use Shopify for commerce outcomes, and trust neither until the tags are disciplined enough to make the comparison meaningful.
#The Direct Traffic Illusion and How to Fix It
A founder sees direct traffic jump and assumes brand demand is rising. Then the same store has a weak email click-through rate, a creator post that drove sales, and a paid campaign that seems to vanish into nowhere. That mismatch is usually not a growth story. It is a tracking story.
Direct is a catch-all bucket. It includes typed URLs and bookmarks, but it also absorbs sessions with missing referrers, untagged campaigns, HTTPS-to-HTTP transitions, in-app browsers, and privacy-related referrer stripping. For a plain-language breakdown of those leakage points, see the direct traffic caveats.
#What a suspicious direct bucket looks like
A healthy direct bucket usually starts on the homepage or another branded entry page. A suspicious one lands deep on product pages, collection pages, or pages close to checkout without a clear reason. That pattern often means a visitor came from email, social, SMS, or paid media, then lost source data before the session was recorded.
Founders get fooled by vanity interpretation. Direct traffic can reflect loyal customers who return by habit. It can also be the place where broken attribution hides. If your store runs email drops, creator partnerships, SMS, retargeting, or app-based traffic, assume some leakage into direct unless you have audited the outbound links and redirect paths.
#The fastest audit sequence
Start with landing pages. If direct sessions are landing on product pages instead of the homepage, the source likely dropped somewhere upstream. Then compare new versus returning visitor patterns. If direct is mostly returning customers, the bucket is more believable. If it is crowded with new visitors, treat it as suspicious.
Practical rule: direct traffic should be a warning light, not a success metric.
Cross-reference the spike against email sends, ad launches, influencer posts, and SMS campaigns. If those activities happened and direct moved instead of the named source, the leak is probably in tagging, redirects, or browser behavior. A practical e-commerce advertising audit helps here because it forces you to check whether the link, platform, and landing page all preserve source data the same way.
The goal is not to make direct traffic disappear. The goal is to shrink the false positives so the remaining direct sessions are direct. Once that happens, brand demand is easier to read, and budget decisions get less noisy.
#Prioritizing Channels for Revenue Growth
Once attribution is clean enough to trust, channel prioritization becomes more useful. A store can get traffic from the right places and still misread what is driving revenue if the tracking is muddy, so the job is to separate true demand from attribution leakage. Founders should judge each channel by volume, conversion efficiency, and revenue per session. That is the only way to decide whether a channel deserves more budget, a fix, or a pause.
#DTC Traffic Source Prioritization Matrix
| Channel | Typical Traffic Share | Conversion Rate | Primary Funnel Role |
|---|---|---|---|
| Direct | Varies by store and tracking quality | Varies | Retention, branded demand, attribution fallback |
| Referral | Usually smaller than organic and paid search | 2.9% in one benchmark (traffic benchmark) | Consideration, trust transfer |
| Organic Search | Often the largest single source in web traffic benchmarks | 2.1% in one benchmark | Acquisition, intent capture |
| Social | Highly uneven across brands | Qualitative, often awareness-led | Awareness, demand creation |
| Owned audience, usually concentrated in returning users | Qualitative, retention-led | Retention, repeat purchase | |
| Paid Search | 23.0% of online traffic in one e-commerce summary (e-commerce traffic summary) | Qualitative, intent-driven | Acquisition, bottom-funnel capture |
| Unknown | Should stay small | Not useful to optimize directly | Attribution gap, cleanup priority |
The table is a working model, not a law of the market. Referral can convert better than organic in one benchmark, while organic still tends to carry much larger scale in many stores. Paid search can represent a substantial share of traffic, while organic social may be tiny in traffic terms and still matter for discovery. In one e-commerce summary, email contributes 4.4% and organic social only 0.9%, which is a reminder that some channels are structurally small in last-click reporting even when they influence the sale path (e-commerce traffic summary).
#How to decide where the next dollar goes
Use three questions. Which channel brings the most new visitors? Which channel converts efficiently? Which channel brings back buyers? GA4 and CRM-style reporting can help separate new visitor traffic from returning visitor traffic, which is a useful clue for whether a source is filling the top of the funnel or mostly reactivating existing customers (visitor split workflow).
For founder-led Shopify stores, the decision usually comes down to three moves. Scale a working channel when it has both healthy volume and acceptable conversion. Fix a broken channel when traffic exists but the conversion path looks weak. Test a new channel only after the core channels are measured cleanly enough that you can tell whether the experiment worked.
If you need a reporting layer that turns those decisions into plain-language priorities, Arlo is one option, since it produces a weekly marketing readout for Shopify stores and ranks actions by urgency and dollar impact. A practical e-commerce advertising audit also helps, because it forces you to check whether the link, platform, and landing page all preserve source data the same way.
#Emerging Traffic Sources Beyond Traditional Search and Social
The old seven-channel framework still matters, but it's not the full map anymore. AI assistants and answer engines are starting to show up in traffic reporting, and they don't behave exactly like classic search or referral. HubSpot now recognizes AI Referrals as a distinct source category and lists platforms like ChatGPT, Claude, Perplexity, Microsoft Copilot, Google Gemini, Meta AI, Mistral, Poe, and Grok among the sources it can identify (AI referral categorization).
#Why this matters for Shopify brands
AI-driven discovery doesn't always fit cleanly into traditional source buckets. Depending on how the visit is passed, it may show up as referral or direct, which means founders can miss the channel entirely if they only look for familiar labels. That's especially relevant for comparison content, educational content, and product-led pages that answer specific buyer questions.
The content strategy changes too. Traditional SEO often targets search results pages, while AI visibility depends more on being useful in generated answers and being easy for models to cite or summarize. That's a different content game, even if the output still feeds the same store revenue.
#What to tag now
SMS and affiliate traffic need the same discipline as email and paid. If those links aren't tagged consistently, they'll collapse into direct or unknown and pollute the rest of the channel mix. For founder-led stores, that mistake hides the true contribution of retention campaigns and partner programs.
Practical rule: if a new discovery channel doesn't have its own tag pattern, it will get swallowed by older buckets.
The move here isn't to abandon classic SEO or social. Search still dominates many traffic patterns, and social still shapes awareness. The move is to prepare your analytics setup so AI referrals, SMS, and affiliate traffic can be measured as distinct behaviors instead of being left to blur into the background.
#Your Weekly Traffic Source Review Checklist
A weekly traffic review should take about 20 minutes, not an afternoon. The goal is to catch attribution issues, spot real shifts, and decide whether the change needs action or just patience. Start with the source report, then move into the channel splits, then check whether the traffic is new, returning, or misclassified.
#The five numbers to check first
- Total sessions by source: Look for the channels that moved, not just the totals.
- New versus returning visitor split: Compare source mix to see whether a channel is acquiring or reactivating.
- Conversion rate by channel: Use this to separate traffic volume from buying quality.
- Revenue attributed to each source: This is the number that keeps the conversation tied to cash.
- Week-over-week changes: Check for sudden jumps or drops before you accept the story the dashboard is telling you.
#What usually needs action
If direct traffic spikes suddenly, inspect landing pages and recent campaigns for missing tags. If organic traffic drops, check whether specific pages lost visibility or whether the issue is reporting noise. If paid traffic keeps coming in but doesn't convert, the problem is usually landing-page mismatch, weak offer fit, or bad audience targeting. Those are different fixes, so don't treat them like one problem.
#The quarterly audit that keeps reporting clean
- UTM consistency: Make sure paid, email, affiliate, and SMS links use the same naming pattern every time.
- GA4 channel grouping validation: Verify that traffic isn't being misfiled by medium or campaign.
- Referral exclusion checks: Confirm that internal or partner domains aren't inflating referral traffic.
- Cross-platform comparison: Compare Shopify, GA4, and ad platform counts to see where attribution diverges.
One more habit pays off fast. Filter direct traffic by landing page and flag any product pages that receive an outsized share of direct sessions. That's often the first place attribution leakage shows up, and it's easier to fix when it's still localized.
If you want a cleaner way to turn traffic data into decisions, Arlo turns Shopify analytics into a weekly plain-language report that flags what changed, what it means, and what to do next. Visit Arlo if you want your traffic source data translated into prioritized actions instead of another dashboard to stare at.