What Is Churn Rate and How to Reduce It
By Arthur Falcone · Founder of Arlo
Churn rate is the percentage of customers lost during a defined period. For an ecommerce founder, it usually means repeat buyers who go quiet inside your normal repurchase window, not only subscribers who formally cancel.
You see it when a Shopify cohort report stops behaving the way it used to. Customers bought once, some reordered, and then the repeat-purchase curve flattened. The store may still be acquiring new buyers, but the older cohorts are disappearing from the revenue picture.
That's the practical answer to what is churn rate. It's a retention metric, but for a DTC brand, it has to reflect buying behavior. A retail customer may never click a cancellation button. If they don't buy again within the period your product normally requires, you need to treat that inactivity as a possible lapse. Ecommerce operators commonly define that repurchase window around 90 or 120 days, depending on the buying cycle (Rivo's ecommerce churn explanation).
Churn matters because acquisition can hide it. New orders may keep total sales moving while repeat demand weakens, acquisition costs rise, and contribution margins narrow. You can't fix that problem until you define who counts as active, what period you're measuring, and whether you're protecting customer count or revenue.
#Table of Contents
- The Moment a Shopify Founder Realizes Churn Matters
- How to Calculate Churn Rate the Right Way
- Customer Churn vs Revenue Churn for DTC Brands
- Ecommerce Benchmarks You Should Compare Yourself To
- What Causes Churn in a Shopify Store
- Strategies to Reduce Churn That Move Real Revenue
- Metrics to Track and How to Read the Changes
- Turning Churn Into a Compounding Advantage
#The Moment a Shopify Founder Realizes Churn Matters
The realization usually arrives in Shopify Analytics, not in a strategy meeting. You pull a repeat-customer cohort report, compare recent buyers with older groups, and notice that the curve no longer climbs as expected. The customers who once reordered on a recognizable schedule have stopped coming back.
Those buyers aren't necessarily lost because they complained or requested a refund. Many stopped responding to your product, emails, or offer. That silent lapse is why a Shopify store needs a broader churn definition than subscription cancellation alone.
A subscription brand can identify churn when a customer cancels or fails to renew. A non-subscription store has to infer it from inactivity. The relevant question is not, “Who canceled?” It's, “Which previously active customers failed to purchase inside the buying window this product creates?”
#Start with the customer behavior
Churn rate is generally calculated as customers lost during a period divided by customers at the start of that period, multiplied by 100 (the standard definition of churn rate). The denominator matters. It represents the existing base you're trying to retain, not every customer who has ever entered your store.
For a Shopify operator, that means separating one-time purchasers from customers who had a reasonable chance to buy again. A skincare brand, supplement store, or replenishment business should set its window around actual product usage. A fashion store may need a longer interval because the customer's buying cycle is less predictable.
Practical rule: If your store treats every historical buyer as equally active, your churn number will be easy to calculate and difficult to trust.
#Connect the metric to the P&L
A falling repeat-purchase curve forces you to spend more energy replacing customers. Paid acquisition may continue to produce orders, but the store loses the compounding value of customers who would otherwise buy again, respond to a replenishment message, or purchase a higher-value bundle.
The rest of the calculation is straightforward. You'll need the customer churn formula, the revenue churn formula, and a benchmark that fits your model. Then you can diagnose whether customers are leaving voluntarily, disappearing because payments fail, or dropping out during the early product experience.
#How to Calculate Churn Rate the Right Way
Set one consistent measurement window before you calculate anything. Monthly, quarterly, and annual churn answer different operational questions. A monthly view helps a replenishment store spot recent retention changes. A quarterly view can smooth irregular buying cycles. Keep the start and end dates aligned so Shopify and Klaviyo reports remain comparable.
#Customer churn
Start with the customers who were active at the beginning of the period:
Customer churn rate = customers lost during the period ÷ customers at the start of the period × 100
If your store starts a month with 1,000 customers in its active retention base and loses 80 buyers, customer churn is 80 ÷ 1,000 × 100, or 8%. Define “lost” around your product's real repurchase window. A subscription cancellation and a customer who has stayed inactive beyond that window may both count, but only if your store treats them as no longer active.
For DTC brands, revenue churn adds the commercial impact:
Revenue churn rate = recurring revenue lost during the period ÷ recurring revenue at the start of the period × 100
A store that begins with $100,000 in monthly recurring revenue and loses $9,000 has 9,000 ÷ 100,000 × 100, or 9% revenue churn. Track both measures because customer count alone can hide the loss of high-value buyers. Recurly's churn benchmark guide provides broader measurement context, but your Shopify customer definition should drive the calculation.
#Avoid denominator mistakes
Two errors distort retention reporting:
- Using total sign-ups: Customers acquired during the period belong in acquisition and growth reporting. They do not belong in the starting retention denominator.
- Including one-time buyers: A shopper who bought a product with no realistic repeat cycle should not automatically count as an active customer who churned.
| Formula | Variables | Worked Example |
|---|---|---|
| Customer churn | Customers lost ÷ customers at start × 100 | 80 lost ÷ 1,000 starting customers = 8% |
| Revenue churn | Recurring revenue lost ÷ recurring revenue at start × 100 | $9,000 lost ÷ $100,000 starting MRR = 9% |
Pull the calculation by signup month, activation timing, product, and customer type. Shopify can show order and customer behavior, while Klaviyo can help connect inactivity with replenishment flows, engagement, and subscription messaging. Cohort analysis keeps a new wave of low-intent buyers from hiding attrition among established customers.
Use customer churn as the primary lens when order values are fairly consistent. Use revenue churn when AOV varies sharply. Losing a small group of premium buyers can matter more than losing a larger group of low-value first-time purchasers.
#Customer Churn vs Revenue Churn for DTC Brands
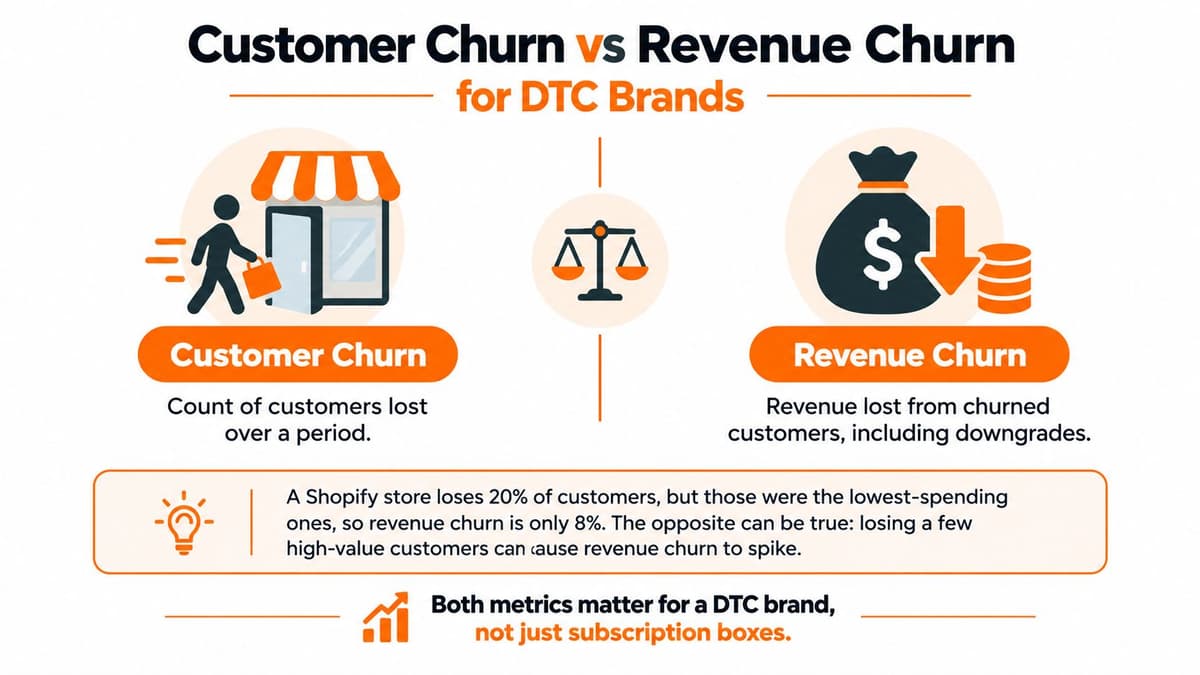
Customer churn counts people or accounts. Revenue churn counts the recurring revenue those customers take with them. A Shopify store needs both because customer volume and commercial value rarely move in perfect alignment.
A brand could lose 20% of its customers while recording only 8% revenue churn if those customers were low-AOV first-time buyers. The reverse can also happen. Losing 5% of customers could cause 25% revenue churn if those customers were premium supplement subscribers or frequent high-value purchasers. Those examples show why a founder should track the metric tied to the revenue they're trying to protect.
#Use the right lens for the decision
Customer churn helps answer questions about product adoption, repeat buying, and the size of your active customer base. Revenue churn helps answer questions about cash flow, recurring revenue stability, and the value of the cohorts you're losing.
A low logo or customer churn rate can still hide damage from downgrades, smaller baskets, or the loss of subscription orders. That's why DTC reporting should connect churn to AOV, product category, subscription status, and gross margin where possible.
Gross revenue churn measures lost recurring revenue before expansion. Net revenue retention adds expansion and subtracts contraction and churn, giving you a broader view of what the existing base is worth over time. The distinction becomes useful when you add upsells, bundles, or subscription upgrades. Arlo's net revenue retention guide lays out that relationship and the role churn plays in the NRR formula.
Track customer churn to understand who leaves. Track revenue churn to understand what the loss costs.
Don't average the two metrics into one blended score. Put them side by side in your weekly review, then investigate the customer segments behind any gap.
#Ecommerce Benchmarks You Should Compare Yourself To
Churn benchmarks only make sense inside a business model. Subscription ecommerce, telecom, banking, B2B SaaS, and consumer replenishment brands have different buying cycles, contract structures, and switching behavior.
For consumer subscription and replenishment businesses, monthly churn commonly falls in the 3% to 7% range, with 5% to 7% often described as typical for consumer product subscriptions and below 5% viewed as strong performance (RecurX's subscription churn benchmark overview). B2B SaaS benchmarks are lower, roughly 1% to 3% monthly, so using SaaS expectations for a Shopify consumables brand will distort your decisions.
A separate 2026 benchmark summary reports monthly logo churn of about 4.2% for SMB accounts under $10k ACV, 2.1% for mid-market accounts at $10k to $50k ACV, 1.3% for upper mid-market accounts at $50k to $100k ACV, and 0.7% for enterprise accounts above $100k ACV. The same benchmark source places healthy B2B SaaS around 3% to 5% annual logo churn, subscription ecommerce at 6% to 10% monthly churn, telecom at 1% to 2% monthly churn, and banking at 5% to 15% annual churn (ScaleXP's customer churn benchmarks).
#Build a DTC comparison table
Non-subscription Shopify stores shouldn't force a cancellation metric onto customers who never enrolled. Track repeat purchase by cohort and compare it with the expected repurchase window.
| Business Model | Monthly Customer Churn | 60-Day Repeat Rate | 120-Day Repeat Rate |
|---|---|---|---|
| Consumer subscription or replenishment | 3% to 7% | Use your product cycle | Use your product cycle |
| B2B SaaS reference point | 1% to 3% | Not applicable | Not applicable |
| Non-subscription Shopify store | Define from inactivity | Track by cohort | Track by cohort |
The useful benchmark is the one your product can reasonably support. Supplements often create more repeat opportunities than fashion, but that doesn't make a universal target valid. Pull customer cohorts from Shopify Analytics, label them by first purchase month and product, and compare each group with similar categories and buying cycles.
Treat benchmark ranges as directional. A single number can't tell you whether churn comes from weak product fit, late delivery, poor reactivation, or a customer mix change.
#What Causes Churn in a Shopify Store
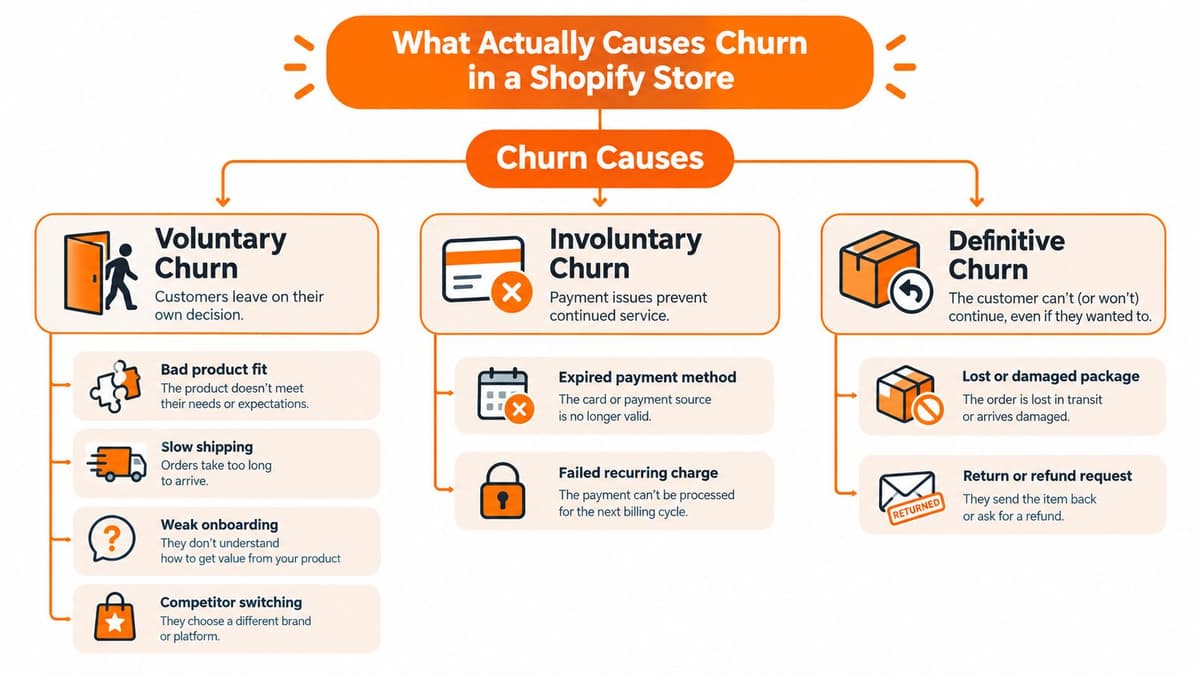
A Shopify founder can watch repeat orders fall without knowing whether the cause is product fit, failed payment, or a weak first-order experience. Separate those events before changing offers. Shopify orders, subscription records, Klaviyo engagement, support conversations, and payment outcomes reveal three useful categories: voluntary churn, involuntary churn, and early-life churn.
#Voluntary churn reflects a value decision
Customers leave when the product no longer fits, delivery feels too slow, onboarding causes confusion, or a competitor presents a clearer option. Check repeat rate by SKU in Shopify, reviews that describe expectation gaps, refund reasons, and customers who stop opening or clicking Klaviyo messages before they lapse.
A customer who buys a bundle and never uses it may need clearer education or a better first-use experience. Repeated delivery complaints point to an operations problem, not a need for another discount. Compare support contacts, delivery status, refunds, and repeat purchases by product to find the source.
#Involuntary churn sits in payment records
Failed payments, expired cards, and declined authorizations can look like ordinary inactivity. Subscription merchants should compare failed recurring charges with successful recovery attempts. Clusters around a processor, card type, or billing date indicate a payment workflow problem.
recoverable revenue strategies 2026 can help you assess payment recovery and cart recovery workflows separately from product retention. In Shopify, track failed charges, recovered orders, and recurring revenue recovered.
#Early-life churn begins after the first order
Early-life churn often appears within the first 30 to 60 days, while customers decide whether the product matches the marketing promise. Refunds, support contacts, and low engagement with onboarding emails are signals to inspect the product experience before changing price.
Compare acquisition source, landing page promise, first-order product, delivery status, and Klaviyo flow engagement. A pattern across these fields usually indicates expectation mismatch or purchase friction rather than a broad willingness-to-pay problem.
Here's a short visual explanation of how these failure points can surface across a customer journey:
#Strategies to Reduce Churn That Move Real Revenue
Start with the tactic closest to lost revenue. Founders often jump to loyalty programs and creative campaigns while failed payments continue removing otherwise valuable subscribers.
#Fix payment recovery first
Set up retries, card-updater support, and clear payment-failure messages for subscription orders. The provided benchmark guidance states that 20% to 40% of involuntary churn may be recoverable through retries and card updaters (RecurX's churn benchmark overview). Measure recovered orders and recovered recurring revenue separately so you know whether the workflow is protecting valuable customers or merely generating activity.
#Build lifecycle messaging around the product
Create a Klaviyo flow for each meaningful repurchase cycle rather than sending every customer the same reminder. A replenishment message should reflect expected usage, include practical guidance, and make the next purchase easy. A post-purchase flow should also address first-use questions, delivery confirmation, product education, and support access.
Segment by product, first-order date, subscription status, AOV, and prior engagement. This customer segmentation example can help you think in terms of actionable groups rather than a single undifferentiated list.
#Add retention plays after the basics work
- Offer flexibility: Let subscribers skip, pause, change frequency, or swap products when the issue is inventory or timing.
- Use loyalty carefully: Reward repeat behavior and useful milestones, but don't make discounts the only reason customers return.
- Trigger proactive support: Route customers with refund requests, poor feedback, or repeated delivery questions into a recovery workflow.
- Test the offer later: Pricing, bundle structure, and product reformulation deserve testing after payment and lifecycle friction are under control.
Measure each tactic against a store metric. Payment recovery should improve recovered recurring revenue. Klaviyo flows should improve repurchase behavior inside the relevant cohort. Subscription flexibility should reduce cancellation or pause activity without worsening AOV.
#Metrics to Track and How to Read the Changes
A useful dashboard is small enough to review every week. Pull the data from Shopify and Klaviyo, then segment it by first-order cohort, product, acquisition source, and subscription status.
Track repeat purchase rate, monthly repurchase rate, AOV by cohort, subscription cancellation rate where relevant, and subscriber email engagement. For email, watch unsubscribes by campaign and flow rather than treating every send as equivalent. If unsubscribe rates rise above 0.5% per send, investigate the message, segment, offer, and sending frequency before increasing volume.
For a consumables brand, a repeat purchase rate below 30% should trigger a review of the product cycle, post-purchase education, and replenishment flow. Use thresholds as operating alerts, not universal laws. A fashion store and a supplement brand won't have the same natural repeat pattern.
| Metric | Where to Pull It | Trigger Threshold |
|---|---|---|
| Repeat purchase rate | Shopify customer cohorts | Below 30% for a consumables brand |
| Monthly repurchase rate | Shopify Analytics and customer reports | Declining inside the expected buying window |
| AOV by cohort | Shopify orders and customer cohorts | Falling among retained cohorts |
| Subscription cancellation rate | Subscription app and Shopify customer records | Rising relative to the store's established baseline |
| Subscriber email engagement | Klaviyo flow and campaign reporting | Unsubscribe rate above 0.5% per send |
Don't panic over one bad week. Ecommerce demand is seasonal, promotions alter mix, and a cohort needs enough time to mature. The provided benchmark guidance recommends treating customers as churned after 60 to 90 days of inactivity when that window fits the business cycle, rather than labeling every late reorder as permanent loss (Rivo's ecommerce churn guidance).
Compare month over month, then compare the same month last year when the store has enough history. Operators who want a broader framework can use this guide to find key conversion metrics and connect retention movement with conversion behavior. For a focused explanation of repeat purchasing, see the repeat purchase rate guide.
#Turning Churn Into a Compounding Advantage
A store becomes more valuable when each cohort keeps producing orders without requiring the founder to reacquire the same customer from scratch. That's the link between churn, lifetime value, margin, and a healthier marketing budget.
The operating rules are simple:
- Define churn by repurchase window: Count inactivity in the context of how often the product should be bought.
- Track customers and revenue: Customer churn shows the size of the loss, while revenue churn shows its commercial weight.
- Benchmark by model: Compare subscriptions with subscriptions and retail cohorts with similar retail behavior.
- Diagnose the cause: Separate voluntary, involuntary, and early-life churn before spending more on acquisition.
- Work weekly: Fix payment recovery, lifecycle messaging, delivery friction, and product education as operating tasks.
- Read mature cohorts: Use 60 to 90 days of inactivity where appropriate before declaring a customer churned.
The next move is specific. In Shopify, identify the worst-performing repeat-buyer cohort, build a Klaviyo reactivation flow for that group, and measure whether its monthly repurchase rate improves inside 30 days. That turns churn reduction into a repeatable flywheel rather than a one-time project.
Arlo offers an AI-powered marketing analyst for Shopify merchants that turns sales, traffic, customer, and product data into a concise weekly report with prioritized actions. Visit Arlo to see what changed in your store, why it matters, and which retention move deserves attention next.