What Is Net Revenue Retention: A DTC Founder's Guide
By Arthur Falcone · Founder of Arlo
You've just had a strong month on Shopify. New-customer revenue is up, paid acquisition looks justified, and the dashboard is giving you plenty of green numbers to celebrate. Then the uncomfortable question arrives: are the customers you already paid to acquire coming back, spending more, or disappearing?
Most ecommerce dashboards answer whether sales increased. They don't tell you whether your existing customer base is becoming more valuable. That's where net revenue retention, or NRR, earns its place. It isolates revenue behavior from an existing customer cohort, so you can see whether retention and expansion are carrying the business, or whether new acquisition is covering for a leaky customer base.
#Table of Contents
- Why Founders Care About Net Revenue Retention
- The Net Revenue Retention Formula Explained
- How NRR Compares to GRR, Churn, and LTV
- NRR Benchmarks for SaaS, DTC, and Subscription Brands
- DTC-Friendly Retention Metrics to Track Alongside NRR
- Prioritized Strategies to Improve NRR for Shopify Merchants
- Your 30-60-90 Day Plan to Move the NRR Needle
#Why Founders Care About Net Revenue Retention
A founder can watch monthly revenue rise while the customer base weakens. Meta ads, Google Shopping, influencers, and affiliates bring in new shoppers, while previous customers stop reordering. The top line hides the problem until acquisition costs increase or growth slows.
NRR removes new customers from the calculation. It isolates what happened to revenue from customers active at the start of the period. Larger packs, add-ons, subscription upgrades, higher usage, and price changes can expand that revenue. Downgrades and cancellations reduce it. The mechanics and definition are detailed in industry analyses such as the Ordway public-company SaaS report.
Consider two Shopify brands. One keeps increasing ad spend and replaces every lapsed customer with another first-time buyer. The other grows more slowly, while coffee subscribers move into larger plans, reorder complementary products, and stay active. The second brand has the stronger compounding engine, even if both stores report similar revenue today.
Founder's rule: New-customer revenue can make weak retention look healthy. NRR shows whether the customers already in your store are expanding or shrinking.
SaaS companies made NRR a central growth measure because it separates new-logo acquisition from expansion inside the existing customer base. McKinsey found that top-quartile B2B SaaS companies reached 113% NRR, while bottom-quartile peers recorded 98%. Existing customers therefore generated 13% growth for the stronger cohort and a 2% decline for the weaker one, according to McKinsey's NRR analysis.
DTC founders need the same discipline, with retention mechanics translated into store behavior. Consumables brands can expand customer revenue through repeat purchases, larger baskets, subscriptions, and replenishment flows. A one-off furniture brand requires a different reading because customers may wait a long time before buying again. A strong NRR benchmark depends on that model, not on a SaaS target copied into Shopify.
Use NRR to judge every growth decision. Before approving more acquisition spend, check whether existing customers are producing more revenue, holding steady, or contracting. Your ecommerce KPI framework should show that distinction instead of burying it beneath blended revenue. Pair the metric with repeat-purchase, AOV, subscription, and post-purchase-flow data so the number points to an action.
#The Net Revenue Retention Formula Explained
Net revenue retention measures the percentage of recurring revenue retained from an existing customer cohort over a defined period. It includes revenue expansion, contraction, and churn. It doesn't include revenue from new customers acquired after the cohort begins.
The standard formula is:
NRR = (Starting MRR + Expansion - Contraction - Churn) / Starting MRR × 100
The same logic can use annual recurring revenue when the measurement window is annual. The important requirement is consistency. Don't combine a monthly starting figure with annual churn or mix customer cohorts from different periods.
#A coffee subscription example
Suppose a coffee brand begins the month with 100 active subscribers paying $40 per month. Starting monthly recurring revenue is therefore $4,000.
During the month:
- 20 subscribers upgrade from the $40 plan to a $60 bag. Each adds $20, creating $400 of expansion revenue.
- 10 subscribers downgrade to a $25 bag. Each loses $15, creating $150 of contraction revenue.
- 8 subscribers cancel entirely. At the original $40 rate, that removes $320 of churn revenue.
The calculation is:
NRR = ($4,000 + $400 - $150 - $320) / $4,000 × 100
NRR = $3,930 / $4,000 × 100
NRR = 98.25%
The cohort retained 98.25% of its starting monthly recurring revenue. The brand added meaningful expansion, but it wasn't enough to offset downgrades and cancellations.
| Line Item | Customers | Monthly Revenue | Notes |
|---|---|---|---|
| Starting cohort | 100 | $4,000 | 100 subscribers at $40 each |
| Expansion | 20 | +$400 | Upgrades from $40 to $60 |
| Contraction | 10 | -$150 | Downgrades from $40 to $25 |
| Churn | 8 | -$320 | Cancellations at $40 each |
| Ending cohort revenue | $3,930 | Starting revenue plus changes | |
| NRR | 98.25% | $3,930 divided by $4,000 |
The metric can exceed 100% when expansion revenue is larger than contraction and churn combined. That's the central idea. Your existing customer base can generate more revenue without adding a single new customer, as explained in Amplitude's NRR formula guide.
For a DTC store, classify every customer-level revenue change before calculating. A larger reorder can count as expansion, a smaller order as contraction, and a customer who doesn't return within the selected window as churn only if your measurement definition treats that period as a loss. Don't change the rules from month to month.
Choose the window before pulling the report. Monthly NRR can reveal fast movement in subscriptions, while annual cohort NRR may make more sense for products with longer repurchase cycles. A monthly calculation and an annual calculation answer different questions, so keep the time period, starting cohort, and revenue basis aligned.
#How NRR Compares to GRR, Churn, and LTV
Founders often put NRR, GRR, churn, and LTV into the same reporting deck as if they were interchangeable. They aren't. Each metric describes a different part of the customer economics.
NRR is the broadest revenue view. It includes expansion, contraction, and churn from the starting cohort. GRR removes expansion, which gives you the retention floor before upsells or larger orders rescue the number. Churn focuses on what was lost, while LTV estimates the total revenue a customer may generate across the relationship.
| Metric | Includes Expansion | What It Answers | Best Used For |
|---|---|---|---|
| NRR | Yes | Is the existing revenue base expanding or shrinking? | Measuring organic growth from existing customers |
| GRR | No | How much starting revenue survived without expansion? | Finding the retention floor and underlying leakage |
| Churn | No | How many customers or how much revenue did we lose? | Identifying cancellations and early warning signals |
| LTV | It can reflect expansion indirectly | What might a customer be worth over the relationship? | Comparing customer value with acquisition costs |
#What each number tells you
NRR is the truest health check for the existing revenue base, but it can hide concentration. A few high-value customers may expand while many smaller customers downgrade or stop buying. That produces a respectable headline while the broader customer experience deteriorates.
GRR is the worst-case floor. Because it excludes expansion, it shows whether your original revenue survives on its own. A brand with weak GRR and strong NRR may be relying too heavily on a small group of customers who buy more.
Churn is the leading indicator of revenue loss. Track it by customer count and by revenue, because losing many low-value customers isn't the same financial event as losing a small number of high-value customers. In DTC, also separate first-to-second-order failure from later lifecycle churn.
LTV is the outcome you're trying to grow. It reflects the value created when customers stay, reorder, and increase their spend. LTV also feeds decisions about acquisition economics and CAC payback, but it won't tell you which current behavior caused the change.
NRR tells you whether the cohort grew. GRR tells you whether it stayed. Churn tells you who left. LTV tells you what the relationship may be worth.
For ecommerce operators, don't publish one retention number without the others. If NRR improves while GRR weakens, investigate whether larger orders from a narrow segment are masking widespread customer loss. If GRR is stable but NRR is flat, your retention engine may work, but your upsell and cross-sell architecture doesn't.
#NRR Benchmarks for SaaS, DTC, and Subscription Brands
A universal “good NRR” target is bad advice. The right benchmark depends on what customers buy, how often they need it, how easily they can increase their spend, and whether revenue comes from contracts or individual transactions.
Public SaaS benchmarks run higher because expansion is part of the product model. Enterprise customers can add seats, modules, usage, or higher service tiers. McKinsey's cited benchmark places top-quartile B2B SaaS at 113% NRR, while bottom-quartile peers sit at 98%. Other benchmark summaries place median public SaaS NRR in the 105% to 115% range during 2024 and 2025, below the 120% or higher peaks seen in 2021 and 2022, as noted in the Ordway public-company SaaS report.
Private-company results vary more. A CRV benchmark reports private B2B SaaS median NRR at 101% in 2025, down from about 117% in 2021. The same source reports that bootstrapped companies with $3M to $20M ARR reached a 104% median and 118% 90th percentile in 2025.
Shopify founders should not copy SaaS targets. A consumables brand can drive repeat purchase through replenishment, larger baskets, and post-purchase flows. A furniture brand may wait much longer for another order. Subscription boxes gain recurring revenue, but skips, pauses, upgrades, and add-ons shape the cohort differently.
| Business Model | Healthy NRR Range | What It Means | Key Caveat |
|---|---|---|---|
| SaaS | 100% to 120%+ | Existing accounts stay and expand through plans, seats, usage, or modules | Enterprise expansion potential is much higher than SMB potential |
| DTC consumables and replenishment | 60% to 90% | Repeat purchasing and larger baskets sustain the cohort | Product cadence and reorder timing heavily affect the result |
| DTC one-off products | 40% to 70% | Some customers return, but many remain dormant after the first purchase | A low figure may reflect category behavior rather than product failure |
| Subscription boxes | 80% to 110% | Recurring billing supports stability, with expansion from plan changes and add-ons | Skip and pause functionality can reshape the cohort |
These DTC ranges are operating heuristics, not universal laws. A skincare brand at 85% NRR may be performing strongly for its category, while a SaaS company at 85% is losing substantial value from its installed base.
Tie the percentage to dollars. A DTC consumables cohort beginning at $1 million in monthly revenue needs roughly $100,000 of net expansion after losses to reach the 110% range. That same dollar amount may barely move a much larger B2B SaaS cohort. NRR becomes useful only after you connect it to cohort size, purchase cadence, and expansion mechanics.
Early-stage NRR requires context. During the first 6 to 12 months, activation and the time required for a second purchase can dominate the result. Compare new cohorts with earlier cohorts before judging performance against an outside target. The CRV analysis also shows why segment and business model change how the metric should be interpreted.
#DTC-Friendly Retention Metrics to Track Alongside NRR
NRR is an aggregate and lagging number. It can confirm that revenue changed without telling you which customer behavior caused the change. Shopify founders need a small set of operating metrics that expose the behaviors before the next NRR report arrives.
#Cohort revenue curves
Start with customer cohorts. Group customers by first-purchase month, then track cumulative spend across later months. A customer cohort export from Shopify can show whether January buyers continue purchasing, increase their order value, or disappear after the first order.
The calculation is straightforward: add revenue from the original cohort during each later period, then compare the curve with other first-order cohorts. A flattening curve signals that repeat purchasing has stalled. A rising curve suggests that the cohort is contributing expansion, not merely surviving.
#Repeat purchase rate by category
Repeat purchase rate measures customers with two or more orders in a defined window divided by total customers, as described in this ecommerce retention guidance. Pull it by SKU category, not just across the whole store. Skincare, coffee, apparel, and furniture have different reasons and timelines for a second purchase.
Track the first-to-second-order rate, the 90-day repurchase rate, and the 12-month retention rate by first-order cohort. A blended store-wide rate can hide the category that is dragging down your NRR.
#Expansion revenue inside subscriptions
For subscription brands, use Recharge or Bold Subscriptions analytics to identify plan upgrades, larger pack selections, add-ons, and increased order frequency. Divide expansion revenue from existing subscribers by starting recurring revenue for the cohort.
For non-subscription stores, use your post-purchase upsell tool and Shopify order data to measure complementary-product adoption at reorder. These movements often predict the next NRR result because they reveal whether customers are increasing spend before the aggregate cohort number changes.
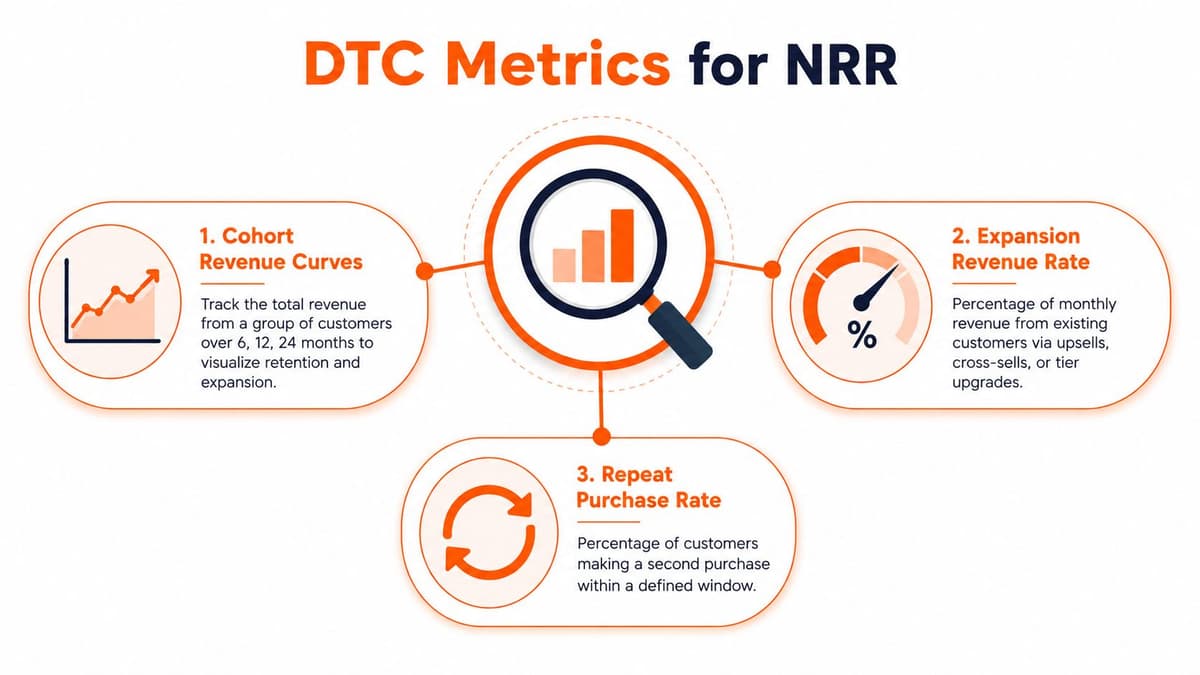
Review these metrics together every month. If repeat purchase rate falls, NRR will eventually feel the pressure. If repeat purchase rate holds but expansion revenue stays flat, improve bundles, subscriptions, or offers. NRR without these breakdowns is a vanity dashboard tile.
Use this repeat purchase rate guide to make the metric useful by cohort and category rather than treating one blended percentage as a strategy.
#Prioritized Strategies to Improve NRR for Shopify Merchants
Fix retention levers in revenue order, not in trend order. The best first move is usually the flow that reaches the largest share of existing customers with the least operational friction.
#Start with post-purchase communication
Build a post-purchase email and SMS sequence in Klaviyo or Shopify Email. Trigger the first message after delivery, follow with product education, request a review after the customer has had time to use the product, and send a replenishment reminder based on the item purchased.
Don't promise a universal lift. Test the flow against a holdout group and measure incremental repeat revenue, not just clicks. The retention strategy guidance for DTC brands cites a 25% to 40% 90-day repurchase target, a 30% to 50% 12-month retention target, and a 40% to 60% or higher repeat purchase target as practical prioritization thresholds.
#Make replenishment and upgrades obvious
Consumables brands should use Recharge or Bold to let customers change quantity, cadence, and product mix without cancelling. Put larger-pack upgrades and complementary add-ons inside the subscription management page, reorder confirmation, and replenishment reminder.
The mistake is making the customer discover expansion on their own. If a subscriber already buys one bag of coffee, show the larger bag and a relevant add-on at the moment they are deciding whether to reorder.
#Build bundles around the second purchase
First-order bundles often raise average order value, but reorder bundles can have a more direct retention role. Use Shopify Bundles or a merchandising app to combine the original product with the item customers most often need next.
Place the offer on the thank-you page, post-purchase email, and reorder page. Measure bundle adoption among existing customers separately from new shoppers, because the goal here is expansion inside the cohort.
#Use loyalty and referrals carefully
Smile.io, Yotpo Loyalty, and referral tools can protect retention, but don't treat points as a cure for weak product value. The cited DTC guidance suggests loyalty programs often move NRR by 1 to 3 points, while margin erosion can offset that improvement if rewards aren't structured carefully.
Give rewards for profitable actions, such as a second purchase, subscription continuation, or a useful referral. Avoid discounting every order and calling the resulting revenue retention healthy.
#Recover dormant customers selectively
Win-back flows matter for brands with long repurchase cycles. Segment customers by product and expected reorder timing, then send a useful reminder, product education, or a targeted offer through Klaviyo. Don't send the same “we miss you” discount to every inactive customer.
| Lever | Estimated NRR Impact | Shopify Implementation | Time to See Results |
|---|---|---|---|
| Post-purchase email and SMS | 2% to 4% | Klaviyo or Shopify Email, triggered by delivery and replenishment timing | After the next reorder cycle |
| Subscription upgrades and reorder nudges | 5 to 8 points when 10% of monthly subscribers move to a larger pack | Recharge or Bold, upgrade prompts in the portal and reminder flow | During the next billing cycles |
| Reorder bundles | Qualitative expansion opportunity | Shopify Bundles, thank-you page, reorder email, and subscription add-on | After repeat orders accumulate |
| Loyalty mechanics | 1 to 3 points | Smile.io or Yotpo Loyalty, rewards tied to profitable actions | After repeat behavior develops |
| Win-back flows | Qualitative recovery opportunity | Klaviyo segments based on product and reorder timing | Depends on the product cycle |
These impact ranges come from the specified industry guidance and should be tested against your own margin and cohort data. Fix one leak at a time. Spending more on acquisition while existing customers contract only compounds the problem.
#Your 30-60-90 Day Plan to Move the NRR Needle
You don't need a data team to establish a useful retention operating rhythm. You need a consistent cohort definition, clean revenue categories, and one test at a time.
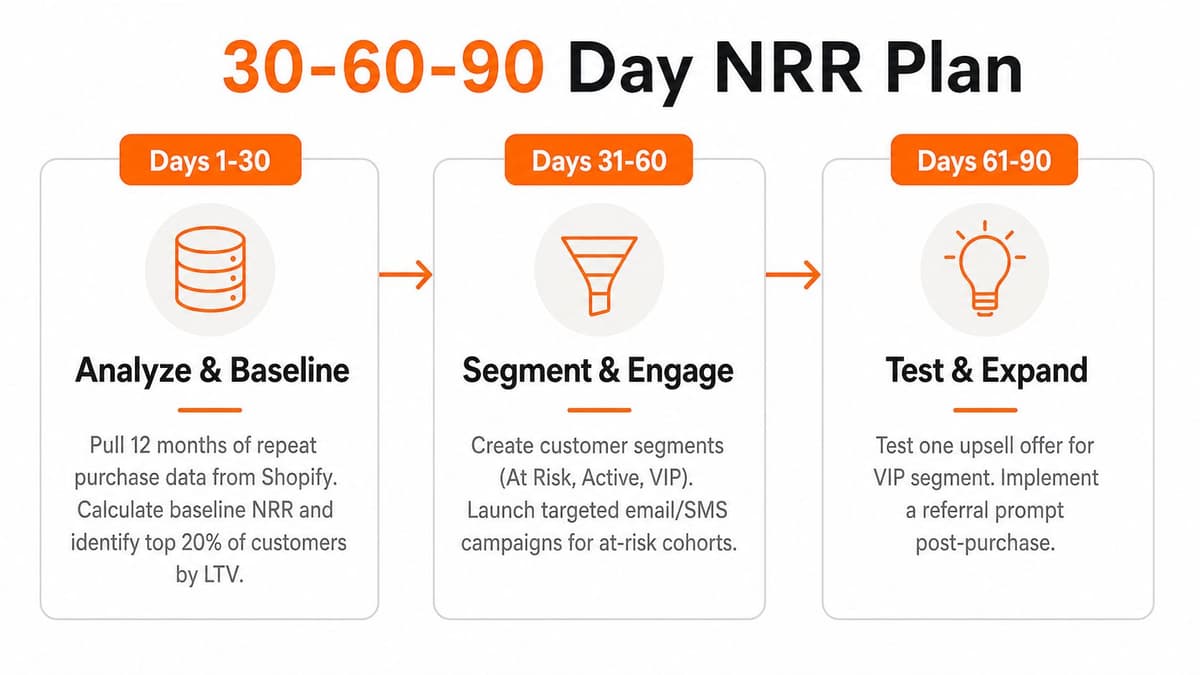
Days 1 to 30, baseline the business. Pull 12 months of repeat-purchase data from Shopify. Calculate NRR and GRR separately, then classify customers as new, retained, expanded, or churned. Segment the result by product category, subscription status, and first-order cohort.
Days 31 to 60, launch one retention motion. Create a post-purchase flow with delivery education, a review request, and a replenishment reminder. Test one reorder bundle or upsell with your highest-value repeat buyers. If you run subscriptions, add a clear larger-pack or complementary-product upgrade prompt.
Days 61 to 90, keep what earns expansion. Compare expansion revenue, repeat purchase behavior, and churn against the baseline. Scale the lever that produced the clearest improvement, remove the activity that didn't move customer revenue, and document the segment it worked for.
Use a monthly business intelligence reporting process to keep the review focused on actions, not dashboard decoration.
This video provides another practical walkthrough of the metric and its use in growth planning:
Keep one rule on the calendar: if expansion revenue from existing customers doesn't outpace losses, the next 30 days focus on retention fixes before new acquisition budget.
Install Arlo to turn Shopify customer, product, sales, and traffic data into a concise weekly action plan that highlights retention leaks and revenue opportunities. It is free up to 500 orders a month, so start there to identify which cohort needs attention first, then act on the highest-impact fix before increasing acquisition spend.