What Is Statistical Significance for Shopify A/B Tests
By Arthur Falcone · Founder of Arlo
Statistical significance means the observed difference in your test is unlikely to be random noise, typically judged against a 95% confidence threshold, but it doesn't guarantee the change matters for your store's bottom line. A result can clear the significance gate and still produce too little practical value to justify changing a revenue-critical page.
It's Friday afternoon. Your Shopify A/B testing dashboard is glowing green, Variant B is marked “winner,” and the result looks just convincing enough to ship before the weekend. You can already picture the new product-page headline lifting sales while your paid traffic keeps flowing.
That reaction is understandable, but a green badge isn't a business case. You need to know whether the result reflects a repeatable customer behavior or a temporary swing caused by who happened to visit your store during the test. You also need to ask whether the difference is large enough to improve revenue, margin, retention, or another metric you manage.
#Table of Contents
- Why Your A/B Test Result Might Be Lying to You
- Statistical Significance in Plain Language
- How to Read A/B Test Results on Shopify
- Common Mistakes That Make You Ship the Wrong Winner
- Sample Size and Why Low-Traffic Stores Need Patience
- Your Statistical Significance Checklist for Every Test
#Why Your A/B Test Result Might Be Lying to You
The founder in this Friday scenario has two separate questions in front of them:
- Is the observed difference probably real rather than random?
- Is the difference valuable enough to act on?
Statistical significance helps answer the first question. It doesn't answer the second.
Suppose a test compares two versions of a product page. Variant B has a higher conversion rate, but the test has attracted a limited and uneven mix of visitors. Perhaps one version received more returning customers, or a short-lived campaign sent unusually motivated shoppers to the store. The dashboard can show a favorable gap even when the underlying customer response hasn't changed in a dependable way.
That's the danger of treating an early result as a conclusion. A founder ships the change, reallocates ad spend, and later watches performance drift back toward the original level. The team then has to roll back the change, explain the inconsistency, and decide whether the next test can be trusted.
Practical rule: A promising result is a reason to investigate, not automatically a reason to deploy.
The concept of significance testing became widely influential after Ronald Fisher's 1925 book Statistical Methods for Research Workers, which helped popularize the p-value as a research tool and encouraged the practical 0.05 threshold. Fisher presented that cutoff as a convenience, not a universal law, as described in this history of statistical significance and p-values. Later work by Jerzy Neyman and Egon Pearson framed testing around decisions and long-run error rates, including control of false positives, a framework discussed in this overview of statistical testing history.
You don't need to become a statistician to use the idea well. You need a repeatable habit: check the confidence level, understand the size of the difference, confirm that the test had enough data, and connect the result to a commercial outcome. That's how Shopify operators make smarter decisions with data without allowing a dashboard label to make the decision for them.
#Statistical Significance in Plain Language
Start with a coin.
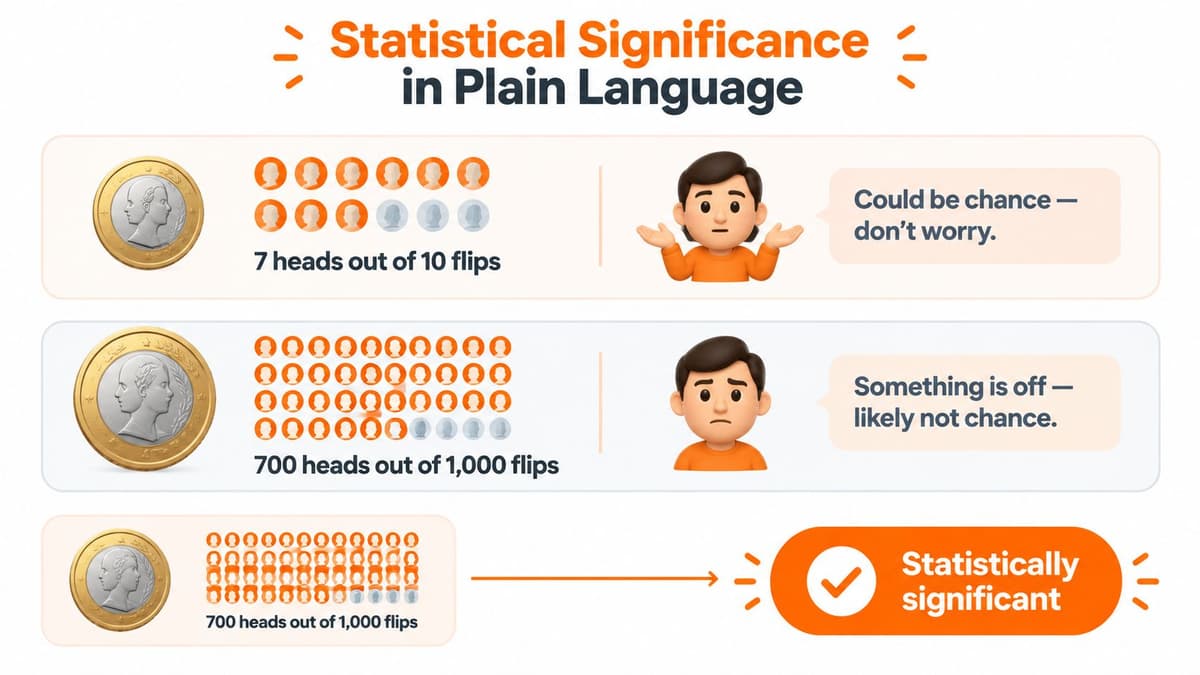
Flip it ten times and get seven heads. That result might feel unusual, but it's still easy to explain as ordinary chance. Flip the same coin one thousand times and get seven hundred heads, and you'd question whether the coin is balanced. The larger set of flips gives you more information about whether the pattern is likely to be random.
An A/B test works in a similar way. Instead of heads and tails, you're comparing customer outcomes, such as purchases, sign-ups, or completed checkouts. The key question is whether the difference between Variant A and Variant B is larger than the variation you'd expect if the two versions performed the same.
#The p-value as a surprise meter
A p-value is a useful way to express how surprising your observed result would be if there were no meaningful difference between the variants. Think of it as a surprise meter, not a score for how good your page is.
A smaller p-value means the observed pattern would be less expected under that assumption. The commonly used threshold is p < 0.05, while p < 0.01 is sometimes used as a stricter cutoff, according to this StatPearls explanation of statistical significance. In plain English, a result below the selected threshold is treated as unlikely under the null hypothesis, which is the technical name for the starting assumption that the variants don't differ.
That doesn't mean the p-value tells you the probability that your new page will make money. It also doesn't measure how large the effect is. It only helps you judge whether the observed separation looks like signal rather than ordinary sampling noise.
#Turning the idea into store language
Consider a reported 0.3% conversion lift. The number alone doesn't tell you whether it's trustworthy. A small lift observed with limited data may be unstable, while the same lift observed across a much larger sample may provide stronger evidence that the variants behave differently.
The reverse is also possible. A statistically significant result can represent a difference that barely changes your commercial outcome. That's why a sound test review combines three questions:
- Signal: Does the confidence or p-value clear the threshold you selected before launch?
- Magnitude: How large is the conversion-rate difference?
- Business value: Would that difference justify implementation effort, added complexity, or a change to paid-traffic economics?
Statistical significance is therefore a gate, not a finish line. It tells your team when a result has enough evidence to deserve a business decision. Your judgment still determines whether the decision is to ship, rerun, segment, or leave the existing experience in place.
#How to Read A/B Test Results on Shopify
Most Shopify testing tools present several pieces of information together. Read them in a fixed order so the most eye-catching number doesn't dominate your judgment.
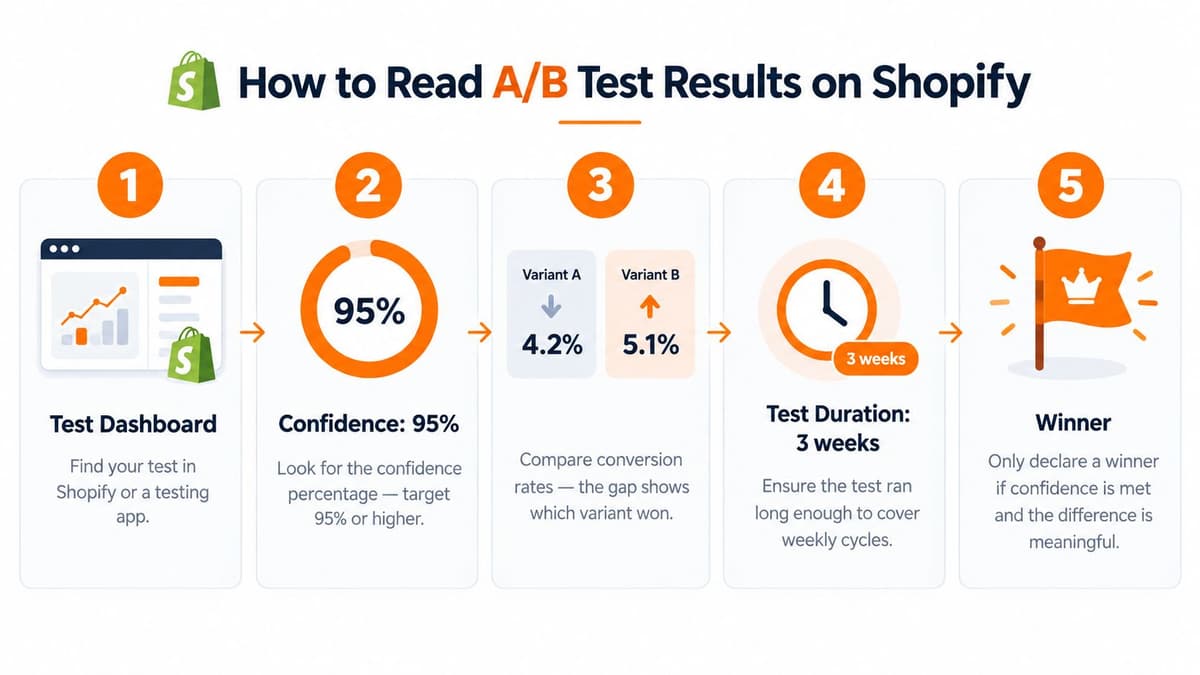
First, find the confidence percentage or its equivalent. A 95% confidence level is the standard benchmark in A/B testing, and Shopify's guidance describes 95% as the threshold most ecommerce teams use before declaring a winner in an A/B testing guide for ecommerce teams. Operationally, this means there's a 5% chance that the observed difference is random noise under the testing framework.
Second, inspect the conversion-rate delta. If Variant A converts at one rate and Variant B converts at a higher rate, note both the original rates and the gap between them. A percentage-point difference and a relative percentage lift aren't the same thing, so use the labels supplied by your tool and avoid mentally inflating a modest movement.
Third, check the sample size and test conditions. A result can look persuasive while relying on too little information, or while mixing unusual traffic from a promotion with normal traffic. Review the audience, device mix, traffic sources, and primary conversion event before you make the page permanent.
#A product-page headline example
Suppose you're testing a product-page headline. The original version explains the product's features, while the variant leads with the customer outcome. The variant reports a higher conversion rate and the tool displays confidence near the 95% benchmark.
Don't treat “near” as “above.” If your pre-set rule is 95%, wait until the result clears that gate rather than shipping because the dashboard looks favorable. If it reaches the threshold, then ask whether the difference is meaningful for the page's revenue role, whether the wording fits your brand, and whether the same promise appears consistently in ads, email, and post-purchase messaging.
Decision rule: Don't make a permanent change to a revenue-critical page until the result reaches your chosen confidence threshold and passes a practical-value review.
This is one part of what is conversion rate optimization, which treats testing as a broader process of improving customer actions rather than collecting isolated dashboard wins. For a wider view of how store data fits together, review this guide to analytics in ecommerce.
A short visual walkthrough can also help your team build a consistent reading habit:
If the result sits below the threshold, keep the test open when the planned sample and duration haven't been reached. If the result remains inconclusive after the planned run, record it as inconclusive. That outcome still protects you from turning weak evidence into a permanent site change.
#Common Mistakes That Make You Ship the Wrong Winner
The first mistake is checking the dashboard too often and stopping as soon as the number looks favorable. This practice, often called p-hacking or repeated peeking, gives random fluctuations more opportunities to look like a conclusion. A founder sees a green badge on an early Friday afternoon, ends the test, and treats timing as evidence.
Set the stopping rule before launch. Decide which primary metric matters, what confidence threshold you'll use, what minimum effect would justify a rollout, and what sample-size target you need. Then follow that plan instead of letting the latest dashboard refresh rewrite it.
#Significance isn't the same as importance
Consider a checkout button color test that attracts 50,000 visitors and produces a 0.1% lift. That lift may clear a statistical threshold because a large sample can make even a small difference easier to distinguish from noise. But statistical significance doesn't tell you whether the resulting revenue is large enough to justify design work, QA, maintenance, or the risk of distracting shoppers from more important checkout improvements.
The right follow-up question is practical: What does this change contribute to the business? Estimate the effect against your actual order economics, then compare that value with implementation cost and opportunity cost. Guidance on statistical significance and practical importance specifically warns that p-values don't measure effect size or real-world importance.
| Scenario | Visitors | Conversion Lift | Statistically Significant | Revenue Impact |
|---|---|---|---|---|
| Checkout button color test | 50,000 | 0.1% | May be significant | May be too small to justify the change |
| Product-page message test | Smaller or unknown sample | Positive result | Requires the chosen threshold | Depends on order value, margin, and traffic |
| Checkout-flow improvement | Sample must be planned | Positive or negative result | Requires the chosen threshold | Can matter if it affects a critical step |
#A non-significant result isn't proof of no effect
A result that doesn't clear the threshold means you don't have enough evidence to declare a reliable difference under the test's design. It doesn't prove the variants perform identically. The study may be underpowered, the effect may be too small to detect, or the test may have experienced noisy traffic, as explained in this review of common significance misinterpretations.
That distinction matters for small Shopify stores. If a test fails to reach significance, keep the result in your experiment log, examine the confidence interval if your tool provides one, and decide whether the potential upside justifies a better-powered rerun. Don't label it “no effect” unless your evidence supports that stronger conclusion.
For KPI selection and interpretation, use a broader ecommerce KPI framework so the test result sits beside revenue, margin, retention, and customer-quality signals instead of standing alone.
#Sample Size and Why Low-Traffic Stores Need Patience
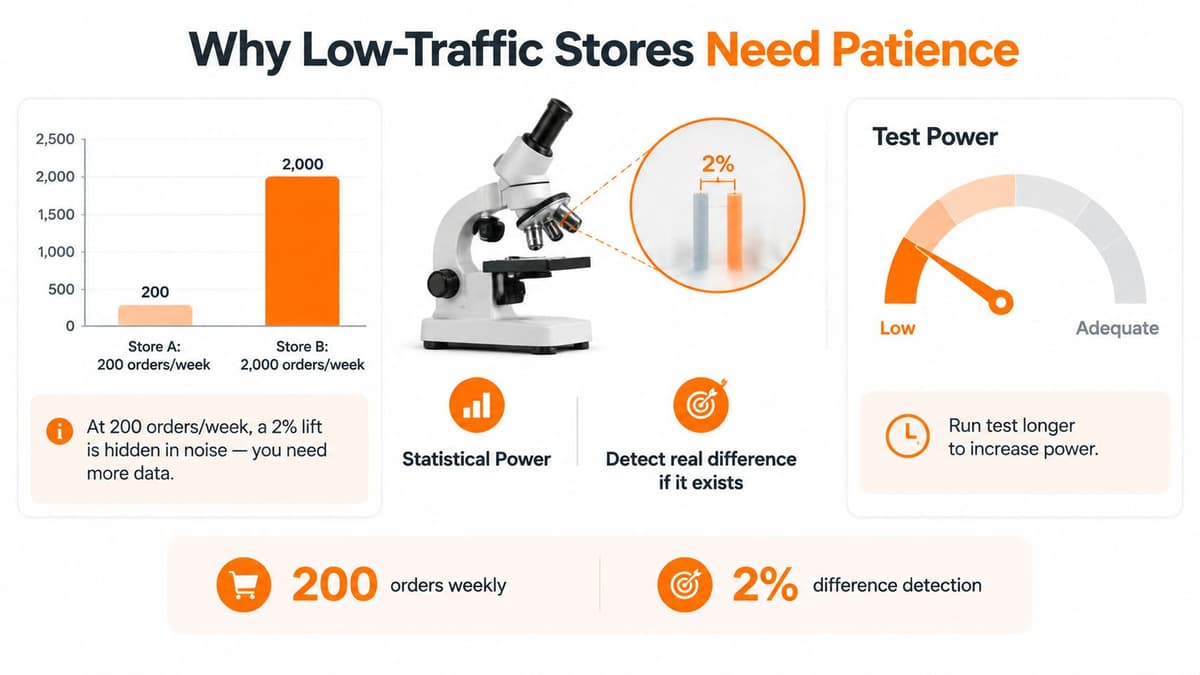
Statistical power is the ability of a test to detect a real difference if one exists. A low-powered test can miss a genuine improvement, while a noisy experiment can produce a result that looks stronger than the underlying behavior.
There's no single minimum sample size that guarantees significance. Required sample size depends on the effect you want to detect, the confidence level you need, and the analysis method. Statistical methods guidance commonly pairs a 0.05 significance level with recommended power of 0.8, as shown in this sample-size calculations resource.
A store receiving 200 orders weekly can't reliably judge a 2% conversion lift from a three-day test. The available data may contain too few purchases to separate a small, real movement from ordinary variation. A larger store can often collect evidence faster, but it still needs planning when the effect it cares about is small.
#Plan before you launch
Use this pre-test routine:
- Choose the primary outcome. Pick one main decision metric, such as completed purchases, rather than changing the goal after seeing the results.
- Define the minimum worthwhile effect. Ask what improvement would justify implementation for your store, considering margin and development effort.
- Set confidence and power targets. Choose the evidence standard before traffic arrives.
- Estimate the required sample. Use your testing platform's calculator or a qualified statistical method rather than relying on a universal traffic rule.
- Set a duration window. Account for normal weekly purchasing patterns and avoid ending the test because one day looks unusually strong.
Low-traffic operators need patience, but patience doesn't mean testing randomly. If the required sample is larger than your normal traffic can provide quickly, prioritize tests with a plausible commercial upside and simpler measurement. Don't run several fragile experiments at once and then select whichever result looks most favorable.
#Your Statistical Significance Checklist for Every Test
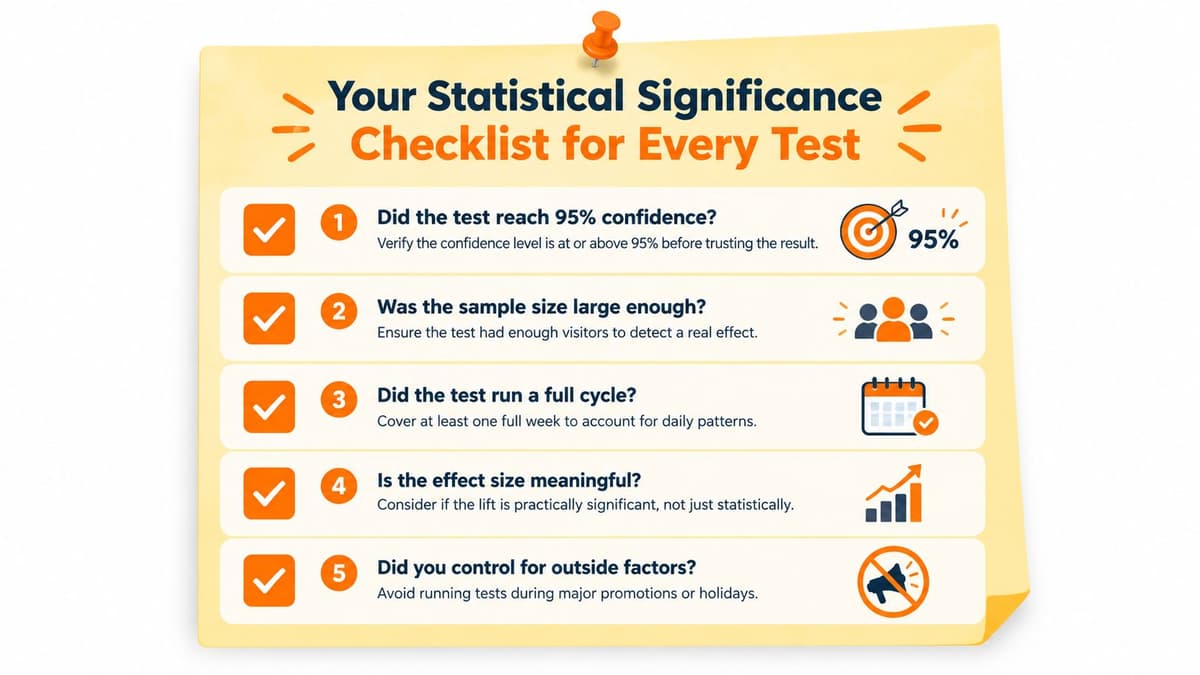
Pin these five questions beside your testing dashboard:
- Did the test reach 95% confidence? Verify that the confidence level is at or above your pre-set benchmark before trusting a winner.
- Was the sample size large enough? Confirm that the test had enough information to detect the effect you care about.
- Did the test run a full cycle? Include normal weekly purchasing patterns instead of stopping during an unusually strong or weak period.
- Is the effect size meaningful? Translate the conversion difference into expected revenue, margin, customer quality, or another business outcome.
- Did you control outside factors? Record promotions, holidays, major campaigns, stock issues, and traffic changes that could distort the comparison.
The numbers tell you what happened in the test. Your understanding of customers, merchandising, margins, and operational constraints tells you whether the result deserves action. A data analytics dashboard for ecommerce can help organize those signals, but it shouldn't replace the discipline of defining the question before launch.
Use statistical significance as a gate against noise, then apply commercial judgment before shipping. That combination keeps your team from chasing tiny dashboard movements while still giving strong, well-planned tests the attention they deserve.
Arlo connects to your Shopify store and turns sales, traffic, customer, and product data into a weekly report explaining what changed, why it matters, and what to do next. Visit Arlo to see how prioritized, plain-language analysis can help you evaluate test results alongside the revenue signals that determine whether a change is worth shipping.