Breakeven ROAS Calculator: A Founder's Practical Guide
By Arthur Falcone · Founder of Arlo
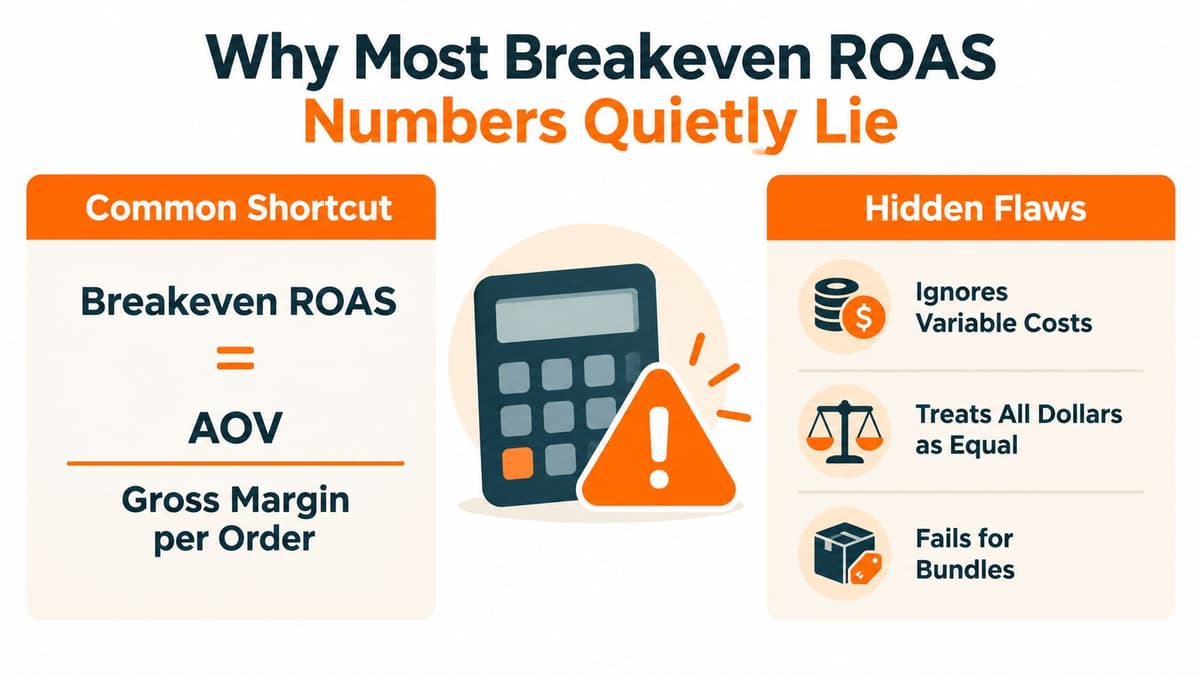
Most founders are told to calculate breakeven ROAS with one clean division: AOV divided by contribution margin. That shortcut is useful, but it's also where a lot of paid media plans go bad. If your revenue includes VAT, your margin ignores refunds, your gateway fees sit outside the model, or your target excludes overhead, the number you paste into Meta or Google can look disciplined while your P&L loses money.
A serious breakeven ROAS calculator should turn every variable cost into a bidding threshold, then extend that threshold into target profit, overhead, retention, and channel decisions. The underlying method starts with contribution margin per order, but it only becomes operationally trustworthy when the inputs use consistent VAT treatment, realistic refund allowances, complete fulfillment costs, and a separate view of fixed costs. The detailed breakeven ROAS calculation framework is a useful reference for building that model from the bottom up.
#Table of Contents
- Why Most Breakeven ROAS Numbers Quietly Lie
- The Inputs That Actually Matter in a Breakeven ROAS Calculator
- The Formulas, the Algebra, and Where Each One Breaks
- Three Shopify Scenarios Run End to End
- Turning the Number Into Bidding, Audience, and Retention Moves
- A Founder's Monday Ritual to Keep the Threshold Honest
#Why Most Breakeven ROAS Numbers Quietly Lie
A breakeven ROAS number can look precise and still make a profitable store bid itself into losses.
The familiar spreadsheet starts with AOV, subtracts product cost, and divides revenue by the remaining margin. That creates a rough variable-cost floor for a simple product. It also assumes every reported revenue dollar can fund advertising. In practice, VAT may belong to the tax authority, refunds can reverse sales after fulfillment, gateways and platforms take their fees, and overhead still has to be paid.
#Four leaks that distort the floor
- VAT treatment: A registered merchant should not treat VAT-inclusive sales as fully available contribution. The ad invoice may follow a different tax treatment, so combining VAT-inclusive revenue with VAT-exclusive costs inflates margin. Strip VAT first where applicable and keep the treatment consistent throughout the model.
- Refunds and chargebacks: A checkout sale is not always retained revenue. The business may return the order value while keeping fulfillment, payment, processing, and reverse-logistics costs. Build the allowance from realized orders after the refund window, not from the optimistic checkout report.
- Platform and gateway fees: Payment processing, merchant fees, transaction charges, and channel costs reduce what each order can contribute. Excluding them gives the bidding algorithm permission to buy revenue that cannot cover its own variable costs.
- Overhead: The per-order floor only shows when variable economics stop losing money. It does not show whether campaigns fund payroll, software, rent, and the rest of the fixed operating base. Set a separate overhead-aware target ROAS before calling a campaign profitable.
Operator rule: If a cost scales with an order, include it in contribution margin. If the company must pay it before declaring profit, include it in the overhead-aware target.
Use the resulting number to make a decision, not to win a reporting argument. A margin shortfall may require a lower bid, a stronger offer, a SKU cut, or more retention revenue through blended LTV uplift. Treat platform ROAS as a measurement output, then compare it with ROAS versus ROI before changing budget. The right threshold should tell a founder what to do on Monday morning, from bidding adjustments to post-purchase retention work.
#The Inputs That Actually Matter in a Breakeven ROAS Calculator
Fill the calculator in the order a CFO would review the business, not the order an ad platform asks for data. Start with revenue, move through variable costs, allocate fixed costs, and only then add any lifetime-value overlay.
#Start with a clean revenue base
Use net AOV as the first line. Define whether it includes shipping collected, discounts, taxes, or other pass-through amounts, then use that same definition everywhere. If you want a practical explanation of how AOV behaves as a store metric, the guide to average order value gives the right commercial context.
Add gross margin inputs next, but don't stop at gross margin. A calculator needs the landed product cost for the average order, including duties and inbound logistics where those costs apply. Then record shipping collected and the share of orders containing bundles or upsells. A larger order only improves economics if the incremental revenue retains enough margin after its incremental costs.
#Build the variable-cost stack
Separate each cost instead of hiding everything inside a single margin percentage:
- COGS: Use the actual product cost attached to the order mix.
- Fulfillment: Include pick, pack, packaging, postage, and any fulfillment surcharge.
- Payment gateway fees: Model both percentage-based and fixed processing charges.
- Merchant and platform fees: Include transaction costs that increase with sales or orders.
- Refund and return allowance: Account for refunded revenue, processing fees, return handling, and unsaleable inventory.
- Creator and influencer gifting: Amortize gifting and seeding costs across the sales they're intended to create.
- Store operating tools: Include the variable or order-linked portion of the Shopify subscription and app stack.
- Ad platform taxes: Add taxes that re-invoice the media purchase rather than assuming the platform-reported spend is the full cash cost.
A hardcoded monthly overhead figure belongs in the model too. Payroll, agency retainers, software, warehouse commitments, and founder compensation don't become free because a campaign reports strong ROAS. Allocate them separately so the calculator can distinguish variable breakeven from business-level target ROAS.
#Add the LTV overlay carefully
Subscription and repeat-purchase brands should add gross margin per renewal, churn-adjusted contribution, and the months used for the LTV view. Don't use a headline LTV figure without its margin structure. Revenue that never repeats, or repeat revenue consumed by fulfillment and support costs, doesn't justify a lower acquisition threshold.
Review the model weekly using rolling 30-day figures. Quarterly snapshots hide mix changes, refund drift, new shipping rates, and the effect of a promotion long after the media team has changed bids.
#The Formulas, the Algebra, and Where Each One Breaks
Run two models side by side. The first answers, “Does this order pay for the advertising?” The second answers, “Can this channel support the business we're trying to run?”
#Per-order breakeven
Let:
- AOV equal revenue per order under your chosen tax treatment.
- Contribution margin per order equal AOV minus COGS, fulfillment, payment fees, refunds, returns, and other variable costs.
- Contribution margin ratio equal contribution margin per order divided by AOV.
Then:
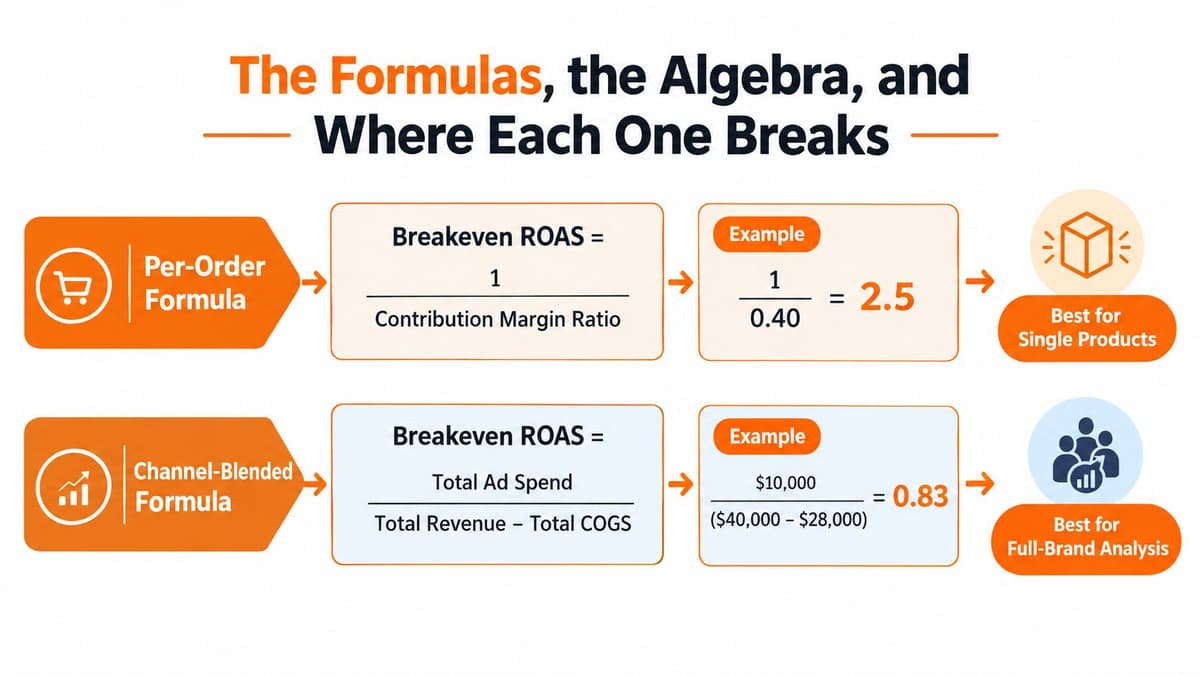
Breakeven ROAS = AOV ÷ contribution margin per order
Because contribution margin ratio equals contribution margin per order divided by AOV, the algebra simplifies to:
Breakeven ROAS = 1 ÷ contribution margin ratio
That identity is the fastest sanity check. If the calculator says the contribution margin ratio is 0.40, the per-order breakeven output is 1 divided by 0.40, or 2.5x. The calculation framework at Eightx's break-even ROAS calculator also extends this logic into target-profit ROAS by incorporating fixed costs, variable-cost assumptions, desired net margin, and paid-ad share.
The formula breaks when orders aren't economically similar. A subscription brand may accept a weak first-order result because later renewals generate contribution. A catalogue brand may sell products with radically different margins and return behavior. One store-wide ratio then becomes too generous for some products and too strict for others.
#Overhead-aware target ROAS
The overhead-aware model starts with the contribution the business needs to generate. Required monthly revenue must cover variable costs, fixed overhead, desired profit, and the planned ad budget. Expressed operationally:
Overhead-aware target ROAS = required monthly revenue ÷ monthly ad spend ceiling
The exact output depends on the calculator's definitions, but the principle is straightforward. If overhead rises while ad spend remains unchanged, the required revenue rises. If the business wants more profit from the same revenue, the allowable ad spend falls.
This formula also has a boundary. Overhead rarely stays constant forever as spend scales. More orders can require additional support, inventory, warehouse capacity, or creative production. Use the overhead-aware result within the operating range it describes, then refresh it when growth changes the cost base.
A trustworthy calculator should also output blended LTV-adjusted ROAS, combining first-order contribution, repeat-purchase contribution, channel mix, and overhead. That's the bridge between the two formulas. It preserves order-level discipline without pretending every customer produces the same lifetime economics.
For founders rebuilding the wider unit-economics model, these break even basics for growing companies provide useful accounting context. The important discipline is to keep the advertising threshold tied to contribution, not to gross revenue.
#Three Shopify Scenarios Run End to End
The formulas become useful when they force a decision. These three Shopify scenarios use the supplied operating assumptions and show how the answer changes when the business model changes.
#Scenario one, single-SKU apparel
The apparel brand has a £65 AOV and a 58% contribution margin after duties and a 7% refund allowance, with no overhead share included in the per-order view. Its per-order breakeven is:
1 ÷ 0.58 = 1.72x
That number is the variable-cost floor. It doesn't mean the brand should set every Meta campaign to 1.72x and scale aggressively. It means a campaign below that threshold isn't generating enough attributed revenue to cover the contribution consumed by the ad spend.
The tactical choice is a Meta bid-cap shift. Set the acquisition structure around the calculated floor, then preserve a buffer for creative testing, attribution noise, and day-to-day volatility. If the brand wants a higher profit target, it should calculate that separately rather than pretending breakeven is the growth target.
#Scenario two, subscription coffee
The coffee brand's first order is £38, but its blended LTV is £142 over eight months at a 28% margin. The LTV contribution is:
£142 × 0.28 = £39.76
Against the LTV base, the implied breakeven ROAS is:
£142 ÷ £39.76 = 3.57x
That calculation shows why the first-order view can mislead, but it doesn't create a sub-1.0x ROAS floor. A sub-1.0x result would require a different denominator or a clearly defined acquisition-value convention, such as comparing first-order ad revenue with a broader LTV contribution pool. Founders shouldn't label that output “breakeven ROAS” without documenting the numerator and denominator.
The tactical choice is to separate subscriber acquisition from one-time purchase acquisition. Subscriber-only audiences may justify a lower first-purchase ROAS target if cohort data proves the later contribution arrives, but the retention model must track churn-adjusted margin rather than headline revenue.
#Scenario three, multi-SKU accessories
The accessories store has a £22 AOV, a 38% contribution margin, and a £9,500 monthly overhead pool. Its per-order breakeven is:
1 ÷ 0.38 = 2.63x
Once overhead is included, its target rises to 3.41x under the supplied scenario assumptions. That divergence matters. A campaign can clear the variable-cost floor while still failing to generate enough contribution to carry the operating base.
The tactical choice is blunt: cut weak SKUs or stop scaling until AOV rises. The founder should group products by contribution, identify which variants consume acquisition spend without enough margin, and test bundles or merchandising changes that raise order value without adding disproportionate fulfillment cost.
| Scenario | AOV / LTV | Contribution Margin | Per-Order Breakeven ROAS | Overhead-Aware Target ROAS | Forced Decision |
|---|---|---|---|---|---|
| Single-SKU apparel | £65 AOV | 58% | 1.72x | Not included | Shift Meta bid caps |
| Subscription coffee | £38 first order, £142 LTV over eight months | 28% | LTV view required | LTV view required | Separate subscriber acquisition from one-time buyers |
| Multi-SKU accessories | £22 AOV | 38% | 2.63x | 3.41x | Cut SKUs or raise AOV before scaling |
#Turning the Number Into Bidding, Audience, and Retention Moves
A breakeven number that sits in a spreadsheet is accounting trivia. Put it into campaign rules.
#Set platform ceilings with intent
For Meta and tROAS bidding, set the operating ceiling at breakeven minus 15% when you're deliberately leaving room for creative-testing variance. That isn't the same as declaring the campaign profitable below breakeven. It's a control range for testing and learning, and the underlying contribution model still determines whether the account can sustain the spend.
For Google Performance Max, set the target at exactly breakeven when search intent is high, then monitor whether the campaign's blended contribution clears the business target. High-intent demand can behave differently from broad prospecting, but the platform target shouldn't obscure the difference between a variable-cost floor and an overhead-aware profit requirement.
#Make the rules product-specific
Build audience exclusions for past purchasers whose realized value remains below your threshold. Suppress viewers and prospecting pools associated with refund-heavy SKUs, because cheap attributed revenue can be expensive after returns.
Cap prospecting budgets at the difference between current ROAS and breakeven ROAS only if that difference reflects real contribution headroom. A reported gap created by VAT treatment, missing fees, or delayed refunds isn't spendable headroom.
Install ROAS floors per SKU. Let high-margin hero products absorb more spend, while low-margin variants automatically bid down or leave acquisition campaigns. A blended catalogue target hides this difference and encourages platforms to find the easiest attributed sale, not the most profitable product mix.
#Use retention levers that change the economics
Post-purchase upsells, subscribe-and-save adoption, and a tighter replenishment cadence can lower the effective acquisition burden when they produce measurable contribution. Vanity retention activity doesn't count. Track renewal margin, churn-adjusted contribution, and the period used for the LTV model.
For a broader view of how analytics should connect attribution to decisions, review this guide to attribution marketing software. The point isn't to collect another dashboard. It's to connect the threshold to a specific bid, audience, product, or retention action.
#A Founder's Monday Ritual to Keep the Threshold Honest
The number drifts because the business drifts. Run the review every Monday, using the same revenue definition and a trailing 30-day window.
- Pull contribution inputs from Shopify Analytics: Reconcile AOV, product mix, fulfillment costs, payment fees, and realized refunds.
- Refresh the refund allowance: Use the trailing 30-day refund and return picture, not the rate from an older quarter.
- Reconcile platform revenue: Compare Meta and Google attributed revenue with Shopify orders. Investigate VAT, fee, discount, and refund mismatches before changing bids.
- Recompute breakeven ROAS: Update the per-order floor, then compare it with the overhead-aware target.
- Refresh overhead monthly: Payroll, tooling, agency costs, and warehouse commitments alter the required contribution.
- Tag every campaign: Mark campaigns green, yellow, or red against the updated threshold, then queue one decision for the week.
Dashboard warning: Meta's ROAS is not your ROAS. It's an attribution output that needs to be reconciled with contribution and cash economics.
Don't trust a dashboard that combines gross revenue with contribution margin. If you're evaluating broader digital marketing analytics tools for 2025, judge them by whether they expose the inputs behind the result and rank the action that follows, not by how polished the chart looks.
Arlo turns Shopify data into a concise weekly “20 Minute CMO” report that explains what changed, why it matters, and which revenue actions deserve attention first. Visit Arlo to connect your store in minutes, replace dashboard noise with prioritized decisions, and start the 14-day free trial.